Creating Thematics
Thematic mapping is the production of maps to express information about a specific phenomenon. Examples of thematic maps include: polygons representing sectors of a city colored differently based on the crime rate of each sector; points representing cities displayed using different symbol sizes based on the population in the city, etc. In JMap, you can create thematic maps using the bound attributes of a layer. Depending on the value of their attributes, map elements will then be displayed differently. Using JMap Admin, you can create as many thematic maps as you want and you can also create many thematics using the same layer.
In JMap, there are 2 main categories of thematics: classifications and proportional quantities.
To create a thematic, press Create in the thematic section of the layer parameters.
New thematic |
|
Name |
Enter a unique name for the thematic. This name will be visible by users. |
Description |
Optionally, you can provide a description for the thematic. |
Next you must select the type of thematic to create.
Classification
Thematics that use a classification separate map elements in a finite number of categories (also called classes), each having a specific style. When a map element part of such a thematic is displayed, it uses the style of the category it belongs to in order to render itself on the screen.
Creating a graduated style thematic
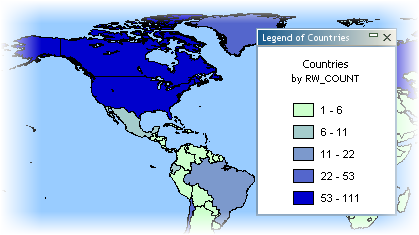
Graduated style thematics use a graduation of one or more visual variables to represent the elements of the different categories. Examples of such graduations include: the fill color of polygons that is graduated from white to red, the size of point symbols that is graduated from size 1 to size 5, the line width of elements that is graduated from 1 to 4, etc. In all cases, there is a finite number of categories and every element of the layer falls in one of those categories. Only a numeric attribute can be used for this type of thematic.
To create a new thematic of this type, you need to select the numeric attribute to use, define the number of categories, select the range calculation method and define the category styles.
There are several methods for calculating the ranges of values for the categories of this type of thematic. See Methods for calculating ranges for more information.
Graduated styles thematic |
|
Attribute |
Select the numeric bound attribute to use. |
Do not draw elements with out-of-sample values |
If this option is selected, elements with values outside of the value range will not be displayed. This can happen when the data is modified after the thematic was created. |
Categories |
Enter the desired number of categories. |
Remove duplicate categories |
In some cases, categories can have the exact same value limits. Select this option to avoid having identical categories. This can happen with very small data sets or if limits are rounded to big numbers. |
Round at |
Select the precision to use to round category range limits. It is often more useful to have rounded limits than very precise ones (e.g. country populations rounded to the nearest million). |
Range calculation method |
|
Calculated categories |
Select the method to use for calculating the range limits of the categories. There are 5 choices: Equal ranges, Equal count, Standard deviation, Defined interval, Percent ranges. See Methods for calculating ranges for more information. |
Custom categories |
Select this option to manually specify the range limits of the categories. |
The next section allows you to define the styles of the categories. There are two possibilities: create custom range styles or use color schemes.
Custom range styles
You must define the from and to values of the style by indicating the style variables that will vary (e.g. border thickness, symbol size, fill color, etc.). The category styles are then generated by interpolation between the from and to styles. Optionally, a third style can be used to create an inflexion point. If an inflexion is defined, the generated styles will pass through the inflexion point at the specified position in percentage. The interface is different based on the element type of the layer.
Custom range styles |
|
Use inflexion point at |
Select this option to use an inflexion point and specify the position of the inflexion. |
Edit base style |
Use this link to modify the style of the layer without leaving the Thematic section. The base style is used to produce the styles of the categories. |
Color schemes
Instead of manually defining styles, you can select a color scheme to generate the styles of the thematic's categories.
Color schemes |
|
Type |
3 types of colors are available: Sequential: The colors form a gradient of sequential colors (e.g. from white to red). Diverging: The colors form a gradient with a central color (e.g. from blue to white to red). Here emphasis is placed on central categories. Qualitative: Colors do not follow any sequence. |
Apply to |
You can choose to apply the palette to the available visual variables (e.g. fill, border, etc.), depending on the type of element on the layer. |
Creating a graduated symbols thematic
Graduated symbols thematics draw symbols superposed on the elements they qualify. The symbol sizes are graduated according to a finite number of categories based on a numeric attribute. The symbols can be used with any map element type. Only numeric attributes can be used for this type of thematic.
There are several methods for calculating the ranges of values for the categories of this type of thematic. See Methods for calculating ranges for more information.
The creation process is the same as for creating a graduated styles thematic.
Creating an individual values thematic
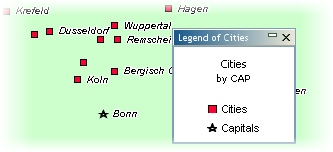
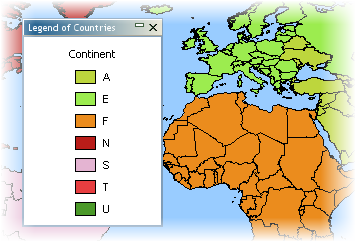
Examples of thematics using individual values classification
Individual values thematics represent all elements that have the same attribute value with the same style. This type of thematic is not using a range of values for each category but rather a specific value. The maximum number of unique different values is 512. If your layer has more different values, it will not be possible to create this type of thematic on that layer. Numeric and non numeric attributes can be used with this type of thematic.
To create a new thematic of this type, basically all you need to do is to select the attribute to use.
Individual values thematic |
|
Attribute |
Select the bound attribute to use. It can be numeric or alphanumeric. |
Do not draw elements with out-of-sample values |
If this option is selected, elements with values not present in the value sample will not be displayed. This can happen when the data is modified after the thematic was created. |
JMap proposes random colors for this type of thematic. You can accept the proposed set of colors or press Regenerate to generate new colors. You can also click on Color Schemes to use a predefined color scheme. When the thematic is created, each style can be manually edited.
Creating an individual custom values thematic
Individual custom values thematics are similar to individual values thematics except that you can define your own values, instead of being limited to values already present in the data. This is useful when you create thematics using a data set that does not contain all the known possible values for an attribute. When new data is later added to this data set, the new values will be handled properly by this type of thematic.
The creation process is similar to creating an individual values thematic except that you have the option to modify the list of individual values by adding, removing or modifying categories.
Proportional quantities
Proportional quantities thematics represent map elements using a continuous variation of a visual variable (e.g. symbol size, fill color, etc.) based on a numeric attribute or set of attributes.
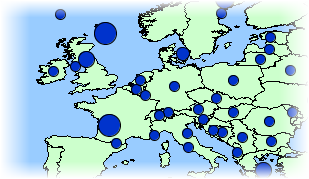
Creating a proportional symbols thematic
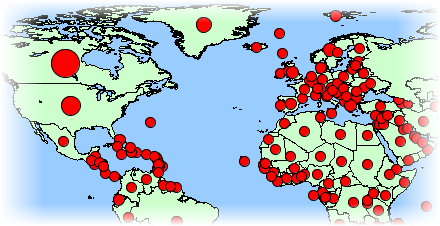
Proportional symbols thematics draw circular symbols superposed on the center of the elements they qualify. The symbol sizes are determined by interpolation between the minimum and maximum values of the attribute. Only numeric attributes can be used for this type of thematic.
To create a new thematic of this type, you need to select the numeric attribute to use and define the from and to styles. The symbol size and color will be interpolated between the from and to values.
Creating a pie charts thematic
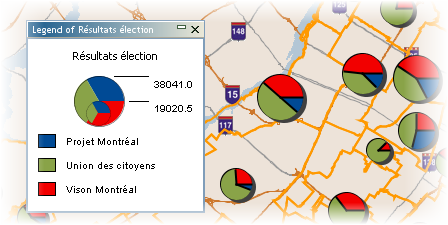
Pie charts thematics draw pie chart diagrams on the center of the elements they qualify. This type of thematic works with one or many numeric attributes. Each part of the diagram (piece of the pie) is associated with a different attribute. The size of the diagram is proportional to the sum of the attribute values. Only numeric attributes can be used for this type of thematic.
To create a new thematic of this type, you need to select one or more numeric attributes to use and define the chart style.
Pie charts thematic |
|
Attributes |
Select one or more numeric attributes. Each attribute will be represented by a piece of the pie chart. The size of the chart will be determined by the sum of those attribute values. |
Skip elements with out of range values |
If this option is selected, elements with values not present in the value sample will not be displayed. This can happen when the data is modified after the thematic was created. |
Ignore negative values |
Select this option to ignore negative values. |
Pie chart style |
|
Chart size |
Select the from size (smaller) and the to size (bigger). The chart size will be determined by interpolation between these two sizes. |
Border thickness |
To draw a border around the chart, select a non zero border thickness. |
Start angle |
Select one of the directions to use as the starting angle of the chart. The first piece of the pie chart will start at the specified angle. |
Draw shadow |
Select this option to draw a shadow for the pie charts. |
Labels |
Select the label type (or none) to indicate the value or relative percentage of each piece of the pie chart. |
Creating a bar charts thematic
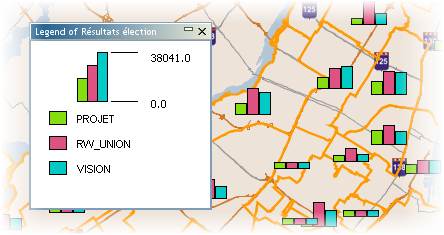
Bar charts thematics draw bar chart diagrams on the center of the elements they qualify. This type of thematic works with one or many numeric attributes. Each bar of the diagram is associated with a different attribute. The size of the diagram is proportional to the sum of the attribute values. Only numeric attributes can be used for this type of thematic.
The creation process is similar to creating a pie charts thematic except for the chart style interface that is slightly different.
Methods for calculating ranges
Several different methods can be used to calculate the ranges of values for the categories of thematics using classifications. These methods are described below.
Method |
Description |
Equal ranges |
The ranges will have equal sizes between the minimum and the maximum values (e.g. 0-10,10-20, 20-30). |
Equal count |
The range limits will be calculated so that an equal count of elements falls in each category. |
Standard deviation |
The range limits will be calculated so that the average value falls in the middle of the categories and each category range size is equal to the calculated standard deviation value. |
Defined interval |
The range size is user-defined and constant for all categories, starting from the minimum value, and adding the defined interval for each category. |
Percent ranges |
The range for each category is expressed as a percentage of the full value range (e.g. 4 categories with 20%, 20%, 35% and 25%). The total must be equal to 100%. |
Custom ranges |
All range limits are user-defined. |