Layers
Table of contents
- Creating Layers
- Importing layers
- Publishing layers
- Configuring Layers
- Layer Permissions
- Sharing Layers
- General Settings
- Dynamic Filters
- Style
- Analysis
- Thematics
- Labels
- Mouseover
- Information Reports
- Bulk editing a layer set
A project is composed of an ordered list of layers. Layers are used to display data extracted from spatial data sources. Each layer is related to a specific spatial data source. Vector layers are related to vector data sources and display vector data while raster layers are related to raster data sources. The layer configuration determines the appearance of the data (style of the layer), the visibility thresholds, what information is associated with the spatial data (attributes), etc. Each layer has its own configuration parameters for labelling, reports, thematics, etc.
Layers are created in the project they belong to. Specific permissions can be configured for each layer. Thus, some layers can be accessed only by a subset of users authorized to open the project.
The layers of a project can be organized into a logical tree-like structure or hierarchy. This feature is useful to better organize information when working with projects that have a high number of layers. In client applications, users are able to control the visibility of the layers belonging to the same group in one click. Refer to the section titled Organizing Layers for more information on this subject.
Layers can be copied from one project to another or even shared between various projects located on the same JMap Server or on separate JMap Servers. Refer to the section titled Sharing Layers for more information on this topic.
The layers of a project are displayed in the Layers section, which may be accessed from the JMap Admin project configuration interface. In the List tab, the table shows basic information about each layer of the project. When you click on the name of a layer, a details section displays. The Hierarchy tab displays the groups and subgroups with the layers that compose them. The tasks you can perform from this tab are detailed in the Organizing Layers section.
In the List tab of the Layers section of a project, you can perform the tasks described in the table. For some tasks, you must select more than one layer.
| Layers | |
|---|---|
| Add - Create | Initiates the creation of a new layer. Refer to Creating Layers. |
| Add - Clone/Reference | Allows you to duplicate or reference a layer from another project located on the same server or on a different JMap Server. Refer to Sharing Layers. |
| Add - Import… | Allows you to import layers one by one from a project exported from another JMap server. Refer to Importing layers. |
| Permissions | Allows you to configure permissions for the selected layers. Refer to Layer Permissions. |
| Update data sources | Updates the spatial data sources associated with the selected layers. Refer to Spatial Data Sources. |
| Update caches | Launches the preparation of the vector data cache for the selected layers. Refer to Creating Layers. |
| Update - Bulk edit… | Allows you to edit certain layer parameters in batches. The Bulk editing a layer set section provides details about this topic. |
| Delete | Deletes the selected layers. |
This button  allows you to access the Permissions section, where you can configure the permissions of the selected layers. See Layer Permissions for more details.
Creating Layers
Each layer of a project in JMap takes its data from a spatial data source. Thus, before layers can be created, the related data sources must already exist (see Creating Spatial Data Sources for more information).
Creating a new layer
To create a new layer, press Create in the Add menu of the Layers section of a project. Note that the new layer will have the same name as the data source by default. The name can be changed later.
| Spatial data source | |
|---|---|
| Spatial data source | Select the spatial data source that will provide the data of the layer. Selecting a vector data source will create a vector layer. Selecting a raster data source will create a raster layer. |
| Name | Enter a name for your new layer. The name must be unique. By default, the layer will take the same name as the selected data source. |
| Description | (Optional) Enter a description for the new layer. This description will be used for administrative purposes. |
The next steps are different for vector layers and raster layers. Note that creating a raster layer is also different for each type of raster data source. Jump to the corresponding section below.
Creating a vector layer
| Element factory | |
|---|---|
| Element factory | Some JMap extensions work with layers composed of complex elements, integrated by several distinct geometries. The spatial data sources associated with the extension allow defining the complex elements. When such a spatial data source is selected for the creation of a layer, this step allows to select the appropriate option to configure the complex elements of the layer. Select the Default factory option for layers composed by a single type of geometry. This step is absent when the spatial data source does not allow to define complex elements. |
| Geometry type | |
|---|---|
| Geometry type | If the data source provides more than one type, select the unique geometry type for the layer. |
| Attributes | |
|---|---|
| Bound attributes | By default, when layer elements (points, lines, polygons, etc.) are served by JMap Server, the element attributes (or descriptive data) are not. This is because the attributes are not “bound” to the elements. Attribute binding binds attribute data to layer elements. Only bound attributes can be used for the following functions: labeling, mouseover, thematic mapping and displaying attributes in the elements or selection explorer. Select and add the attributes to the list on the right to bind them to the layer. The other attributes will still be available for other functions like attribute queries and information reports. Note that the number of bound attributes has an impact on network and memory usage and thus can reduce the overall performances. Therefore, attributes should only be bound when necessary. |
| Geometry angle (layers of points only) | |
|---|---|
| Angle attribute | This section is only available for layers of points. In this section, select a numeric attribute that contains the rotation angles for the symbols representing the points of the layer. If you select an attribute of the angle, the symbols will be displayed with a rotation following this attribute value. |
| Units of angular measure | Choose the rotation unit to apply: degrees or radians |
| Direction | Choose the rotation direction. Angle values can be interpreted clockwise or counterclockwise. |
| Origin of rotation | Choose the origin of the rotation to apply: geographic (north) or arithmetic (east). |
The request mode determines how the vector data is managed by JMap Server. It can greatly influence the system’s overall performance.
| Request mode | |
|---|---|
| Load by tile | The data is requested by rectangular zones (tiles) defined by a predetermined fixed grid that covers all the layer data. Structuring layer data in tiles makes data management more efficient, for network transfers, memory management and cache storage. If the grid is not properly configured, this can have a negative impact on the system’s performance or lead to operational problems. When you press the Estimate button, JMap performs a calculation to determine the best configuration for the grid. You can accept these values or modify them according to your needs. This mode offers the best performance because once a tile has been extracted from a data source, it can be cached for a certain amount of time and reused effectively. This is the recommended mode for most applications. |
| Load by region | The data is requested by random regions, according to the user’s navigation actions on the map. Each time the layer needs to be displayed in the application, a new request is sent to JMap Server and the data is extracted again from the spatial data source. This mode is very dynamic as no caching is used, and users can see data changes at every map manipulation (zoom, pan, etc.). Note however that it is much more intensive for JMap Server and, if not used properly, it can affect the system’s general performance. This mode must be used for dynamic data. Typically, this data is found in a relational database and can be randomly modified. This is the case for layers that are editable by JMap. |
Advanced parameters
Most of the time, the following advanced parameters don’t need to be modified.
| Advanced (optional) | |
|---|---|
| Transformation | Apply a translation: Translate each geometry of the layer by X units horizontally and Y units vertically. The original data is not affected. Generalize geometries: Generalize (simplify) geometries using the specified tolerance. For a given geometry, all nodes that are closer together than the tolerance are eliminated. In addition, all nodes that are located on the same straight line are eliminated. The original data is not affected. Reduce precision (better performance): Use data compression to improve performance. In some rare situations, this option can noticeably reduce data precision. From JMap Dakar, this option is unchecked by default for new layers to avoid performance issues. Layers configured in earlier versions of JMap are not affected. |
| Caching | This section allows you to define server data caching rules for the vector data and its attributes. The cache is on the server. This improves performances because once data is in the cache, JMap Server does not need to load it again from the data source. Activate server data caching for this layer: Use this option to enable or disable data caching on the server for this layer. Automatically build the cache when the data source is updated: If caching is enabled, this tells JMap Server to flush and rebuild the cache for this layer, when the corresponding spatial data source gets updated. Building the cache in advance helps to prevent delays for the users. Building the cache may take a long time, depending on the volume of the data. Cache timeout: This instructs JMap Server to cache the data no longer than the specified time period. When the timeout is reached, the data is requested again from the data source. This is mostly useful for spatial data sources that get their data from spatial data servers to which JMap Server is connected (Oracle Spatial/Locator, ESRI geodatabases, PostGIS, MySQL Spatial, etc.). Update layer cache after I click “Finish”: Select this option to have the cache built immediately for this layer. Building the cache may take a long time, depending on the volume of data. |
| Base Filter | SQL conditions: SQL conditions are used to filter the elements of the spatial data source. Only the elements that satisfy the SQL conditions will be on the layer. This allows you to create many layers showing different data using the same spatial data source. SQL conditions are interpreted directly by the database system so the syntax is the same as that of an SQL WHERE clause. The WHERE keyword is not necessary. |
Creating a raster layer based on a WMS data source
To create a raster layer based on a WMS spatial data source, you need to tell JMap what data to request from the WMS server. The WMS server publishes a list of all the layers it can serve and their properties. In JMap, the WMS layer creation interface allows you to select the layers to include in the WMS layer you wish to create.
| WMS raster layer | |
|---|---|
| Connection type (Direct/Server) | The connection type determines if JMap Pro applications will request images directly from the WMS server or if they will send the requests to JMap Server, which in turn will query the WMS server. JMap Web applications are not affected by this setting. If Direct is selected and a JMap Pro application fails to connect to the WMS server, the connection mode will revert to Server. Note that if JMap Server is behind a firewall/proxy, it may need proxy authentication settings in order to access the Internet. See JMap Server Settings for more information. |
| Output format | The list of output formats offered by the WMS server. You can select the format to use. |
| Background color | Tells the WMS server what color to use in the background of the map images. Any area where there is no data will be filled with this color. |
| Use background color as transparent color | Tells the WMS server to use the background color as the transparency color. Using transparency allows the map images to be placed on top of other layers without completely hiding them. |
| S.R.S. | The list of Spatial Reference Systems offered by the WMS server for the layer. You can select the one to use.Make sure the selected SRS is consistent with the project projection because JMap cannot reproject images received from WMS servers. |
| Available layers | The list of layers the WMS server is publishing. If you hold your mouse pointer on a layer name, its description will display automatically, along with its attributes. The attributes determine if the layer is Queryable (supports GetFeatureInfo requests), Cascaded (comes from another WMS server) or Opaque (not transparent, i.e. the layers found under it will not be visible). |
| Selected layer(s) | The layers selected among those that are available appear in this list. Click on  to add a new layer to this list. You can select the style to be used. A default style is always provided. Click on to add a new layer to this list. You can select the style to be used. A default style is always provided. Click on  to delete a selected layer. to delete a selected layer. |
Creating a raster layer based on a GDAL, TIFF/GEOTIFF or ECW/ECWP data source
| Raster layer | |
|---|---|
| Image format | Select the image format to use for image transfers between JMap Server and JMap Pro applications. For air photos, JPEG usually gives the best results. |
| Image format parameters | Only used with JPEG image format to specify the quality factor (1 means excellent quality and low compression while 0 means low quality and high compression). Test with different values to determine what fits your needs. A value of 0.5 is usually a good compromise. Example: quality=0.6 |
| Background color | Tells JMap Server what color to use in the background of the images. Any area where there is no data will be filled with this color. |
| Use background color as transparent color | Tells JMap Server to use the background color as the transparency color. Using transparency allows the map images to be used on top of other layers without completely hiding them. |
Creating a raster layer from a WMTS data source
| WMTS raster layer | |
|---|---|
| Layer | Select the layer from the WMTS server that you wish to use to create the layer. Only layers who have the same projection as the project are selectable. |
| Style | Select the layer style. |
Importing layers
You can add a layer to a project by importing it from a project that has been exported from another JMap server. The Exporting and Importing section provides details on exporting and importing a JMap server’s resources. To import a layer in a project, you must also create a data source in JMap Server containing the data of the imported layer.
When you select Add / Import… the Importation wizard will guide you through the process to import one or more layers from the project where they are found.
-
To start the process, select the Importation file. Click on Browse to access the File browser.
-
Select the .properties file that contains the project whose layers you wish to import.
-
Click on Next.
-
Select the Project that contains the layer you wish to import.
-
Select the Layers to import.
-
Click on Next.
-
If the project in which you are importing the layer contains a layer with the same name as the one you are importing, select an option to resolve the conflict between these layers: Create a new layer with a different name, Replace the existing layer or Use existing layer.
-
Click on Next.
-
If the JMap Server in which you are importing the layer contains a spatial data source with the same name as the data source of the layer you are importing, select an option to resolve the conflict between these data sources: Create a new data source with a different name, Replace the existing data source or Use existing data source.
-
Click on Next.
-
A summary lists the number of imported resources for the project: layers, databases, remote connections, spatial data sources, style templates, and metadata templates.
-
Press Import. The layer is added to the project and a new spatial data source is created in JMap Server.
Publishing layers
A layer must be published to be accessible to the users. A layer that is not published is not part of the project, and in no way can users see it or access it.
When a new layer is created, it is not published by default. This allows you to do further configuration tasks on the layer before making it available for the users. For example, it is important to configure visibility thresholds appropriately according to the scale before the layer can be seen by users.
After layer creation, you must press the Publish button in the layer’s detail section.
Unpublishing an existing layer can be useful to make it unavailable to the users without actually deleting it.
Configuring Layers
The layer configuration interface allows you to access layer information as well as parameter configuration functions such as style, labels, or reports.
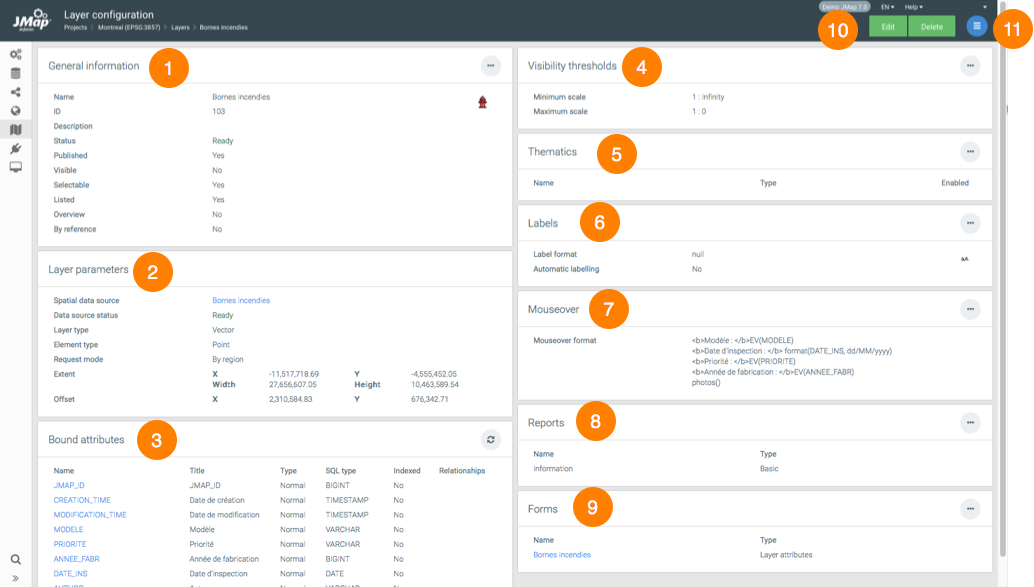
| 1 | General information configured when creating the layer. This button  provides direct access to the section settings configuration interface. provides direct access to the section settings configuration interface. |
| 2 | Layer parameters configured when it was created. The hyperlink allows you to access the spatial data source that contains the layer data. |
| 3 | Bound attributes. This section presents a list of attributes related to the layer. Click on the name of an attribute to open the configuration window of its properties. This button  is used to update the statistics of the attributes. is used to update the statistics of the attributes. |
| 4 | Layer visibility thresholds; shows the limits between the minimum and maximum scales for displaying layer elements. |
| 5 | Thematics. This section presents the layer’s thematics. Click on the name of the thematic to access its configuration interface. |
| 6 | Labels. This section presents information on the labels. |
| 7 | Mouseover. This section describes the mouseover configured for the layer. |
| 8 | Reports. This section presents the reports configured for the layer. |
| 9 | Forms. This section presents information about forms configured for the layer. Click on the form name to access its configuration interface. |
| 10 | These buttons allow you to edit the layer configuration or delete it. |
| 11 | The menu provides access to the sections General, Permissions, Style, Thematics, Labels, Mouseover, Forms and Reports. |
The raster layer configuration interface contains the General information, Layer parameters, and Visibility thresholds sections.
Attributes
The Attribute configuration window contains three tabs: Metadata, Statistics, and Attribute sample.
| Metadata | |
|---|---|
| Type | Indicates the type of data for the attribute. |
| SQL Type | Indicates the SQL type of the data for the attribute. |
| Indexed | Check this box to have the attribute indexed. |
| Title | You can change the title of the attribute. This icon  allows you to provide the title in multiple languages. allows you to provide the title in multiple languages. |
| Format pattern | Specify a format pattern for displaying SDS items. The pattern must follow Java standards. For more details on this topic, read the following article: https://docs.oracle.com/javase/tutorial/i18n/format/decimalFormat.html. |
The Statistics tab provides simple statistics about the attribute. The Attribute sample tab displays the value of the attribute for a sample of layer elements.
Layer Permissions
There are several different types of permissions for a project’s layers. The following tables describe each one of these.
Administrator permissions
| Permissions | |
|---|---|
| Remote access | Allows a user to access this layer through a JMap Server to JMap Server connection. This permission must be granted to the account of the user who established the secure connection between both JMap Servers. For more information on this topic, refer to the JMap Server to JMap Server Connections section. |
User permissions
| Permissions | |
|---|---|
| View this layer | Allows a user to view a layer in JMap’s applications. By default, the everyone user (everyone who has permission to open the project) is authorized to view any new layer. To restrict access to a layer, you must remove this permission from everyone and only add it to the users of your choice. |
| Add elements | Allows a user to add new elements on the layer and enter attribute values using the form associated with the layer. Editing must be enabled on this layer in order for this permission to be available. |
| Modify elements | Allows a user to modify the geometries of the elements (move, add/remove nodes, etc.) found on the layer. Also allows the user to modify attribute values using the form associated with the layer. Editing must be enabled on this layer in order for this permission to be available. |
| Delete elements | Allows a user to delete existing elements on the layer. Editing must be enabled on this layer in order for this permission to be available. |
| Modify attribute values | Allows a user to open the form of a layer’s element attributes and to modify their values. Editing must be enabled on this layer in order for this permission to be available. |
| Copy / export elements | Allows a JMap Pro user to copy the data of the layer to another layer, or to export the data of the layer using the JMap Exportation extension. |
To modify layer permissions, press  in order to select the users and groups to which you wish to grant permissions. Only the users and groups who are already authorized to open the project containing the layer can be granted permissions associated with this layer.
Sharing Layers
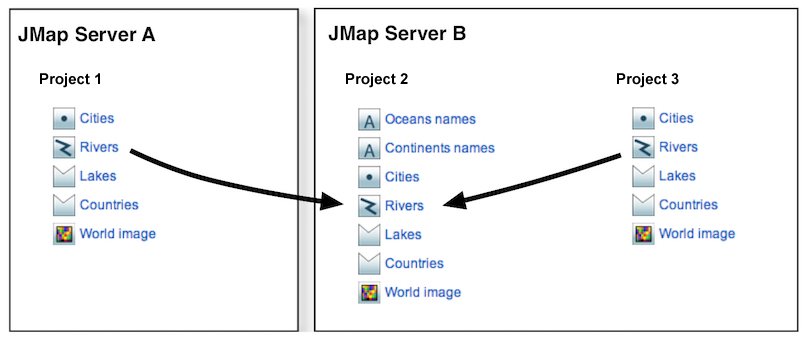
JMap allows you to share layers between projects that are on the same server or that originate from remote servers that are connected. Layer sharing allows you to manage data more effectively (avoids duplication, saves time) by reusing existing layers instead of creating new layers in each project. When the original layers are modified, the changes can automatically be viewed in all projects that have referenced layers pointing towards these shared layers. Referenced layers cannot be modified directly, save a few basic settings. Only the original shared layer can be modified.
The figure presents the layer sharing between projects on the same server and on different servers. The properties of the Rivers layer cannot be modified in projects 1 and 3. The original layer is in project 2.
Sharing layers between projects on the same JMap Server
To share layers between projects on the same JMap Server, no action is required. Layers can be accessed freely from any project on the same server. Refer to Accessing shared layers for more information.
Sharing layers between different JMap Servers
If you wish to share a project’s layers in order to access them from another JMap Server, you must assign a special remote access permission to a user for these layers. In order to do this, access the project layers section for which you wish to share these layers.
-
Select one or more layers.
-
Click on Permissions.
-
In the permission management interface, select the user account or group to which you wish to assign the remote access permission (you can add user accounts and groups by clicking on
). -
Select the Remote access permission. The account used must match the user account through which the connection to this JMap Server was established. If you are using a group, the aforementioned user account must be included within it.
Once the layers have been shared, they can be selected from the remote JMap Server and inserted in this server’s projects. Refer to Accessing shared layers for more information.
To stop layers from being shared, simply remove the Remote access permission from these layers.
Accessing shared layers
To access existing layers from different projects located on the same JMap Server or shared layers on other JMap Servers, you must click on Add and select Clone / Reference in the layers section of the project to which you would like to add these layers.
In the Clone / Reference layers section:
-
Select a JMap Server from which you wish to clone or reference layers. If you choose Local server, you can select the projects and layers of the local server without these being shared. The other servers in the list are the JMap Servers for which a JMap Server to JMap Server connection exists. Refer to the JMap Server to JMap Server Connections section for more information on creating JMap Server to JMap Server connections.
-
Select the project from which you wish to clone or reference layers. Once the project has been selected, the list of available layers displays.
-
Select the layers you wish to clone or reference and move them to the list on the right.
-
Select the Clone or Reference option.
If you choose the Clone option, the selected layers will be duplicated towards your project. They will be exact copies of the original layers, but there will be no connection between the copies and the original layers. You can modify the copies without affecting the originals. If you delete a cloned layer, this doesn’t affect the original layer. If you delete the original layer, this doesn’t affect its cloned layers. However, duplicated layers always use the same spatial data source as the original layer. If this data source is modified or deleted, this will affect the duplicated layers.
If you select the Reference option, the original layers will be accessed by reference. This means that a direct connection will be maintained between the layers of your project and the original layers. You will not be able to modify these layers in your project. If the original layers are modified, the changes will appear wherever references to these layers exist, after a short delay. If you delete a referenced layer, the original layer will not be affected. If you delete the original layer, the referenced layers will no longer work and will have to be deleted manually.
General Settings
The layer general settings section is accessible by clicking on the settings drop-down menu, then selecting General in the layer details section. This section allows you to specify basic layer parameters. These parameters are described below, along with the visibility thresholds.
General
| General | |
|---|---|
| Name | The name for the layer. Names attributed to layers in the same project must be unique. By default, the name of the associated spatial data source is used. |
| Description | An optional text to describe the layer. In JMap applications, this text can be viewed by users in a mouseover bubble on the layer name. |
| Published | Determines if the layer is published or not. See Publishing layers for more information. |
| Visible | Determines if the layer is visible or not when the project is opened. Users can make layers visible or invisible in JMap applications. |
| Selectable | Determines if elements of the layer will be selectable or not when the project is opened. Users can modify selection options in JMap applications. By default, the elements of the new layers that you create are not selectable. |
| Show in overview | Determines if the layer will appear in the map overview, if present. This overview simplifies map navigation. |
| Listed | Determines if the layer will be listed in the layer manager in JMap applications. A layer that is not listed appears on the map normally. |
Scale thresholds
Scale thresholds are used to control the visibility of a layer according to the scale of the displayed map. This is useful when you want to hide elements of a specific layer beyond (or under) a certain scale. For example, you might not want to display the local street layer when looking at the whole territory of a country. Using the thresholds, you could specify that the local streets are to be visible only when looking at a map with a scale greater than 1:100000. In that case, you would specify a minimum scale of 1:100000, without indicating a maximum scale.
| Scale thresholds | |
|---|---|
| Minimum scale | Minimum scale in order for the layer to be visible. Allows the layer to become invisible when the user zooms out too much. |
| Maximum scale | The maximum scale in order for the layer to be visible. Allows the layer to become invisible when the user zooms in too much. |
| Non modifiable | (Applies to JMap Pro only) Determines if the users are allowed to modify these values. Modifying these scales on the JMap Pro side for layers that contain a high number of elements could cause very long queries that use a lot of resources or even lead to unusual responses from the JMap Pro application or JMap Server. |
Dynamic refresh
The dynamic refresh of the layer is used to automatically reload the data of a layer after a configured delay, without the need for the user to manipulate the map. This can be useful for layers that contain data that is updated regularly, such as layers of vehicle tracking (AVL). This is an alternative to the use of layers by region to have dynamic data.
| Dynamic refresh | |
|---|---|
| Dynamic | Select this option to activate the dynamic refresh. |
| Refresh every | Specify the delay between each refresh. |
Dynamic Filters
Dynamic filters are used to display certain elements of the layer that match the user’s criteria. JMap Pro applications support dynamic filters for layers that load by region or tile. JMap Web applications support dynamic filters for layers that load by region.
Dynamic filters are defined using an attribute, an operator, and values for the attribute. A dynamic filter can be composed of several attributes. Operators vary depending on the attribute type.
Text-type attributes provide full or partial match operators as well as the presence of null values. Up to 2048 unique values are supported in drop-down menu mode. For attributes who have more unique values than this number, value selection is done by entering the values in the range.
Numeric type attributes offer quantitative operators.
Date type attributes provide time operators and calendars for choosing dates. Dynamic time operators can also create mobile windows from a selected date.
To create a dynamic filter:
-
Press Dynamic Filters in the layer settings menu.
-
Click on the plus icon
 to add an attribute.
 -
Select an operator and values in the appropriate ranges. You can add as many attributes as you want. To remove an attribute from the filter, select it and click on the minus icon
 .
. -
Check the Enabled box to make the dynamic filter active when a user opens a JMap Pro or JMap Web application.
-
Click on Save to save the dynamic filter.
###Filter operators
equals: This operator filters a layer’s elements to display the elements whose attribute value (regardless of its type) is equal to one of the values selected by the JMap administrator.
does not equal: This operator filters a layer’s elements to display the elements whose attribute value (regardless of its type) is different from the values selected by the the JMap administrator.
greater than: This operator filters a layer’s elements to display the elements whose attribute value (numeric or date) is greater than the value selected by the JMap administrator.
greater or equal to: This operator filters a layer’s elements to display the elements whose attribute value (numeric or date) is greater than or equal to the value selected by the JMap administrator.
less than: This operator filters a layer’s elements to display the elements whose attribute value (numeric or date) is less than the value selected by the JMap administrator.
less or equal to: This operator filters a layer’s elements to display the elements whose attribute value (numeric or date) is less than or equal to the value selected by the JMap administrator.
contains: This operator filters a layer’s elements to display the elements whose attribute value (text) contains the value selected by the JMap administrator.
is empty: This operator filters a layer’s elements to display the elements whose attribute (text) does not have a value.
is not empty: This operator filters a layer’s elements to display the elements whose attribute (text) has a value.
is null: This operator filters a layer’s elements to display the elements whose attribute value (regardless of its type) is null.
is not null: This operator filters a layer’s elements to display the elements whose attribute value (regardless of its type) is not null.
is between: This operator filters a layer’s elements to display the elements whose attribute value (numeric or date) is within the range defined by the two values entered by the JMap administrator.
is not between: This operator filters a layer’s elements to display the elements whose attribute value (numeric or date) is not within the range defined by the two values entered by the JMap administrator.
last: This operator filters a layer’s elements to display the elements whose date attribute value is within the range (expressed in years, months, week(s), day(s), hour(s)) defined by the JMap administrator.
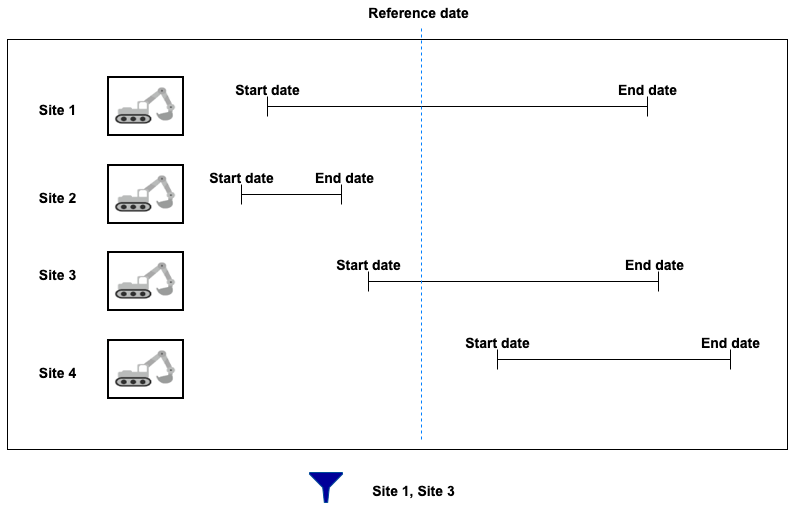
interval: This operator filters a layer’s data based on time ranges defined using a start date, an end date and a reference date. The user therefore has a tool to display data that varies over time.
The layer must contain at least two date and/or timestamp attributes, one of these being the start Date/Time, and the other being the end Date/Time. The values of these dates can be NULL to indicate a start date that goes a long way back or an end date that is very far in the future.
A reference date is also needed. This date can be a specific date (in the past or in the future) or a current Date/Time, which indicates the present moment.
Only layer elements whose reference date is between the start and end date are displayed in the map.
The following figure illustrates this filter.
Style
The style of a layer determines the graphical representation of its spatial elements on the map. For example, the style of a line is determined by its thickness, color, dash pattern, etc. In JMap, each layer can have multiple styles. The style used depends on several factors.
Different styles can be configured for different scales. For example, a layer can have a single style for all scales while another layer can have one style for scales greater than 1:20000 and another style for scales smaller than or equal to 1:20000.
Layers also have selection styles. These styles are used to display selected elements at different scales. The selection styles are generated automatically from the layer styles but they can be customized for each layer.
The presence of thematics on a layer will override the layer styles. When a thematic is active on a layer, the style of each element is determined by the value of its attributes and the thematic’s parameters. See Creating Thematics for more information.
Managing layer styles
You can define one or more styles for a layer. If there are many styles, each one will be used within a certain range of scales. By default, one style exists for each layer and it covers the full possible scale range. To manage the styles of a layer, press Style from the layer settings menu.
To add a new style, press . In the style configuration interface, you must define the maximum scale from which the new style will be used. Its minimum scale will automatically be set to infinity or to the maximum scale of the next style.
To remove a style, select it from the list and press  . Note that the greater scale style cannot be deleted. When deleting styles, the remaining styles will be adjusted to cover the full possible scale range.
Once you have configured one or more styles, you can click on Create template (located to the right of each style) to create a new style template from one of the layer’s styles. The style template will automatically be linked to the layer. See Style Templates for more information.
JMap Pro users can change the style of layers and save their changes by creating cartographic contexts. These contexts can be shared with other users and made public to all users who access the application. JMap Web users can save a map by creating a customized map. When the JMap administrator modifies the style of a layer, the JMap Pro and JMap Web users working with contexts may not be able to view the style changes made by the JMap administrator. To force the update of the layer style in the contexts, click on Force update… (located to the right of each style). By doing so, the style changes will be reflected in all the contexts of JMap Pro applications and in all the customized JMap Web maps that contain the layer.
Creating or Modifying a style
You have the option to use an existing style template or to configure your own style. If you want to use a style template, click on Use a style template. You will then choose to refer to it or to copy it.
If no style template is used, you need to configure the parameters that will define the style. Style configuration interfaces are different depending on the type of element (points, lines, polygons, text, etc.). Some style parameters are common to many element types but others are specific to certain types.
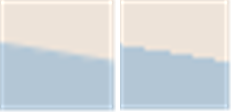
Antialiasing is a method of representing perfect, continuous vectors on imperfect, discontinuous display devices so that they look as perfect as possible. In every style configuration section in JMap Admin, antialiasing is enabled by default, which improves the appearance of your maps. However, display performances are reduced when antialiasing is enabled, so use it judiciously.
The following figure shows an example of a polygon border with antialiasing (left) and without antialiasing (right).
Partial object transparency can be used for every type of map element. A map element with a transparency value of 0% will be completely opaque while one with a 100% value will be invisible.
The following figure shows an example of a polygon with a transparency value of 50% (left) and one with a transparency value of 10% (right).
![]()
Styles for points
| Style parameters for points | |
|---|---|
| Symbol | Select the symbol that will be used to represent the elements. The symbol can be a vector symbol or an image. Vector symbols are provided with JMap and offer special features. They can be resized without distortion and their border and fill color can be modified. However, they cannot be customized easily. JMap offers image libraries, which include SVG images. These image libraries are accessed under the Images tab. You can also provide your own image libraries. Their quality will be decreased if they are resized, unless you use SVG images. To provide your own images, place them in the following directory: JMAP_HOME/JMapAdmin/icons Supported image formats are svg, gif, png and jpeg. If subdirectories are created, they will be seen when browsing the image directory. This allows you to organize your image library. You can also upload new images by clicking on  in the symbol selection window. The maximum image size is 100 Mb. in the symbol selection window. The maximum image size is 100 Mb. |
| Size | Specify the size of the symbol. A value of 1 corresponds to the original size of the symbol or image. |
| Proportional size | Select this option if you want the size of the displayed symbols to vary in proportion with the map scale. You must enter the reference scale that will display the normal size of the symbols. |
| Use antialiasing | Select this option to activate antialiasing. |
| Transparency | Specify the partial transparency of the symbol. |
| Offset (x,y) | Adjust the original point of the symbol by offsetting the symbol by X and Y according to the specified values. The original point corresponds to the exact coordinates of the point element. |
| Rotate symbol with the map | Select this option to have the symbol rotated when the map is rotated. If this option is not selected, the symbol will always have its default angle, regardless of the map rotation. |
| Rotation | Specify the rotation to apply to the symbol. |
| Border thickness | (For vector symbols only) Specify the border thickness of the vector symbol. |
| Border color | (For vector symbols only) Specify the color of the lines of the vector symbol. |
| Transparent fill | (For vector symbols only) Select this option to have the inside of the vector symbol completely transparent. |
| Fill color | (For vector symbols only) Specify the color of the interior of the vector symbol. |
Styles for lines
| Style parameters for lines | |
|---|---|
| Transparency | Specify the partial transparency of the line. |
| Arrow type | Specify the arrow option to use: None: No arrow. Forward: Place an arrow on the line pointing toward the last point of the line. Backward: Place an arrow on the line pointing toward the first point of the line. |
| Arrow position | If an arrow is used, determines the relative position of the arrow. A value of 50% places the arrow in the center of the line. |
| Line thickness | Specify the thickness of the line, in pixels. |
| Line color | Specify the color of the line. |
| Stroke style | Specify the stroke style (dashed, solid, with border, etc.) to use to draw the line. JMap provides many stroke styles. |
| Border thickness | If the line has a border, specify its thickness. |
| Border color | If a line stroke with a border is used, specify the color of the border. |
Styles for polygons
| Style parameters for polygons | |
|---|---|
| Use antialiasing | Select this option to enable antialiasing. |
| Transparency | Specify the partial transparency of the polygon. |
| Transparent fill | Select this option to have the inside of the polygon completely transparent. |
| Fill color | Specify the color of the interior of the polygon. |
| Stroke style | Specify the stroke style (dashed, solid, with border, etc.) to use to draw the border of the polygon. JMap provides many stroke styles. |
| Border thickness | Specify the thickness of the borders of the polygon. |
| Border color | Specify the color of the border of the polygon. |
| Pattern | Specify the fill pattern to use. JMap provides many patterns. |
| Pattern color | If a pattern is used, specify the color of the pattern. |
| Transparent pattern fill | If a fill pattern is used, select this option to make the pattern background completely transparent. |
Styles for annotations
| Style parameters for text | |
|---|---|
| Use antialiasing | Select this option to enable antialiasing. |
| Transparency | Specify the partial transparency of the text. |
| Font | Specify the font used to display the annotation text. |
| Bold | Select this option to use bold text. |
| Italic | Select this option to use italic text. |
| Underlined | Select this option to use underlined text. |
| Striked through | Select this option to use strikethrough text. |
| Outlined | Select this option to use outlined text. Outlined text has an outline that may be of a different color. This helps make the text on the map more readable. |
| Outline color | If outlined text is used, specify the color of the outline. |
| Text color | Specify the color of the text. |
Styles for images
| Style parameters for images | |
|---|---|
| Transparency | Specify the partial transparency of the image. |
Selection style
There is a selection style for each style of the layer. The selection styles are used to represent the elements when they are selected on the map. By default, the selection styles are generated automatically using the layer’s basic styles and the project’s default selection color.
To modify the selection style, unselect the Generate from default style option and adjust the style parameters as needed.
Analysis
In addition to configuring the style of a layer, you can also create graphical representations to analyze the distribution of point data.
Clustering
Clustering, as its name implies, creates clusters of points on the screen. Special symbols are used to graphically represent these clusters on the map and display the number of elements they contain.
| Parameters | |
|---|---|
| Distance | Minimum distance (in pixels) between 2 points in order for them to form a cluster. |
| Minimum elements | The minimum number of elements required to create a cluster. |
| Symbol | Symbol used to represent a cluster on the map. |
| Label | The settings of the label (font, color, etc.) that will display the number of elements in a cluster. |
Heat maps
Heat maps are used to graphically represent the concentration distributions of a type of object or event on the territory. The more the color of a zone is intense, the more the concentration is high.
| Parameters | |
|---|---|
| Radius | The radius used to display the density map around each point. |
| Weight | Numeric attribute that determines the weight of each point to display the density map. The more the weight is high, the more the color is intense. This parameter is optional. |
| Opacity | Determines the degree of opacity for the display of the density map. |
| Intensity | Defines the intensity of the colors based on the concentration of points. If the intensity is lower, more points will be needed to produce intense colors. |
| Display points | Allows you to display the points of the layer under the density map. The points will be hidden by the density map if the opacity is very high. |
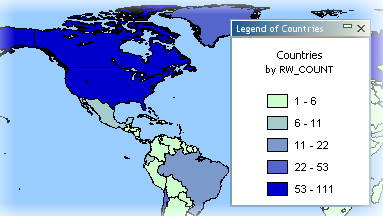
Thematics
Thematic mapping is the production of maps to express information about a specific phenomenon. Examples of thematic maps include: polygons representing sectors of a city colored differently based on the crime rate of each sector; points representing cities displayed using different symbol sizes based on the population in the city, etc. In JMap, you can create thematic maps using the bound attributes of a layer. Depending on the values of their attributes, map elements will then be displayed differently. Using JMap Admin, you can create as many thematic maps as you want and you can also create many thematics using the same layer.
In JMap, there are two main categories of thematics: classifications and proportional quantities.
To create a thematic, press Create in the Thematics section of the layer settings.
| New thematic | |
|---|---|
| Name | Enter a unique name for the thematic. This name will be visible by users. |
| Description | You can provide a description for the thematic. |
| Type | Select the type of thematic you wish to create. The following steps will depend on the type of thematic you have chosen. |
Classification
Thematics that use a classification will separate map elements into a finite number of categories (also called classes), each having a specific style. When a map element belonging to such a thematic is displayed, it uses the style of the category it is part of in order to render itself on the screen.
Creating a graduated styles thematic
Graduated styles thematics use a graduation of one or more visual variables to represent the elements of the different categories. Examples of such graduations include: the fill color of polygons that is graduated from white to red, the size of point symbols that is graduated from size 1 to size 5, the line width of elements that is graduated from 1 to 4, etc. In all cases, there is a finite number of categories and every element of the layer falls into one of those categories. Only a numeric attribute can be used for this type of thematic.
To create a new thematic of this type, you need to select the numeric attribute to use, define the number of categories, select the range calculation method, and define the category styles.
There are several methods for calculating the ranges of values for the categories of this type of thematic. See Methods for calculating ranges for more information.
| Attribute | |
|---|---|
| Attribute | Select the numeric bound attribute to use. |
| Do not draw elements with out-of-sample values | If this option is selected, elements with values outside of the value range will not be displayed. This can happen when the data is modified after the thematic was created. |
| Create a category for null values | Select this option if you want null values to be represented in the thematic. |
| Categories | |
|---|---|
| Categories | Enter the desired number of categories. |
| Range method | Select the method used to determine the bounds of the value ranges. Refer to Methods for calculating ranges for more information. |
| Remove duplicated categories | In some cases, several categories can have the exact same value limits. Select this option to avoid having identical categories. This can happen with very small data sets or if limits are rounded to big numbers. |
| Round at | Select the precision to use to round category range limits. It is often more useful to have rounded limits than very precise ones (e.g. country populations rounded to the nearest million). |
The next section allows you to define the styles of the categories. There are two possibilities: create custom range styles or use predefined color schemes.
Custom range styles
You must define the from and to values of the style by indicating the style variables that will vary (e.g. border thickness, symbol size, fill color, etc.). The category styles are then generated by interpolation between the from and to styles. Optionally, a third style can be used to create an inflexion point. If an inflexion is defined, the generated styles will pass through the inflexion point at the specified position in percentage. The interface is different based on the element type of the layer.
| Custom range styles | |
|---|---|
| Use inflexion point at | Select this option to use an inflexion point and specify the position of the inflexion. |
| Edit base style | Use this link to modify the style of the layer without leaving the Thematics section. The base style is used to produce the styles of the categories. |
Color schemes
Instead of manually defining styles, you can select a color scheme to generate the styles of the thematic’s categories.
| Color schemes | |
|---|---|
| Type | 3 types of color schemes are available: Sequential: The colors form a gradient of sequential colors (e.g. from white to red). Diverging: The colors form a gradient with a central color (e.g. from blue to white to red). Here emphasis is placed on central categories. Qualitative: Colors do not follow any sequence. |
| Apply to | You can choose to apply the palette to the available visual variables (e.g. fill, border, etc.), depending on the type of element on the layer. |
Creating a graduated symbols thematic
Graduated symbols thematics draw symbols superposed on the elements they qualify. The symbol sizes are graduated according to a finite number of categories based on a numeric attribute. The symbols can be used with any type of map element. Only numeric attributes can be used for this type of thematic.
There are several methods for calculating the ranges of values for the categories of this type of thematic. See Methods for calculating ranges for more information.
The creation process is the same as for creating a graduated styles thematic, as described above.
Creating an individual values thematic
Individual values thematics represent all elements that have the same attribute value with the same style. This type of thematic is not using a range of values for each category but rather a specific value. The maximum number of unique different values is 512. If your layer has more different values, it will not be possible to create this type of thematic on that layer. Numeric and alphanumeric attributes can be used with this type of thematic.
To create a new thematic of this type, basically all you need to do is to select the attribute to use.
| Individual values thematic | |
|---|---|
| Attribute | Select the bound attribute to use. It can be numeric or alphanumeric. |
| Do not draw elements with out-of-sample values | If this option is selected, elements with values not present in the value sample will not be displayed. This can happen when the data is modified after the thematic was created. |
| Create a category for null values | Select this option if you want null values to be represented in the thematic. |
JMap proposes random colors for this type of thematic. You can modify styles manually or click on Color Schemes to use a predefined color scheme.
Creating an individual custom values thematic
Individual custom values thematics are similar to individual values thematics except that you can define your own values, instead of being limited to values already present in the data. This is useful when you create thematics using a data set that does not contain all the known possible values for an attribute. When new data is later added to this data set, the new values will be handled properly by this type of thematic.
The creation process is similar to creating an individual values thematic, except that you have the option to modify the list of individual values by adding, removing or modifying categories.
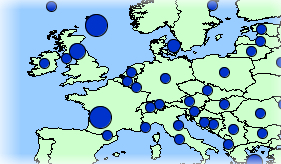
Proportional quantities
Proportional quantities thematics represent map elements using a continuous variation of a visual variable (e.g. symbol size, fill color, etc.) based on a numeric attribute or set of attributes.
Creating a proportional symbols thematic
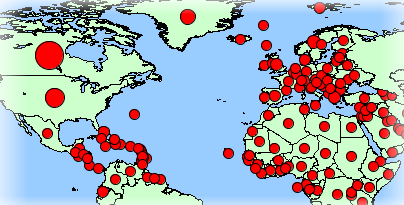
Proportional symbols thematics draw circular symbols superposed on the center of the elements they qualify. The symbol sizes are determined by interpolation between the minimum and maximum values of the attribute. Only numeric attributes can be used for this type of thematic.
To create a new thematic of this type, you need to select the numeric attribute to use and define the from and to styles. The symbol size and color will be interpolated between the from and to values.
Creating a pie charts thematic
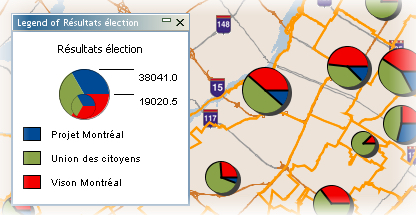
Pie charts thematics draw pie chart diagrams on the center of the elements they qualify. This type of thematic works with one or many numeric attributes. Each part of the diagram (piece of the pie) is associated with a different attribute. The size of the diagram is proportional to the sum of the attribute values. Only numeric attributes can be used for this type of thematic.
To create a new thematic of this type, you need to select one or more numeric attributes to use and define the chart style.
| Pie charts thematic | |
|---|---|
| Attributes | Select one or more numeric attributes. Each attribute will be represented by a piece of the pie chart. The size of the chart will be determined by the sum of those attribute values. |
| Do not draw elements with out-of-sample values | If this option is selected, elements with values not present in the value sample will not be displayed. This can happen when the data is modified after the thematic was created. |
| Ignore negative values | Select this option to ignore negative values. |
| Pie chart style | |
|---|---|
| Chart size | Select the from size (smaller) and the to size (bigger). The chart size will be determined by interpolation between these two values. |
| Border thickness | To draw a border around the chart, select a non zero border thickness. |
| Start angle | Select one of the directions to use as the starting angle of the chart. The first piece of the pie chart will start at the specified angle. |
| Draw shadow | Select this option to draw a shadow for the pie charts. |
| Labels | Select the label type (or none) to indicate the value or relative percentage of each piece of the pie chart. |
| Colors | Select the color of each portion of the pie chart. |
Creating a bar charts thematic
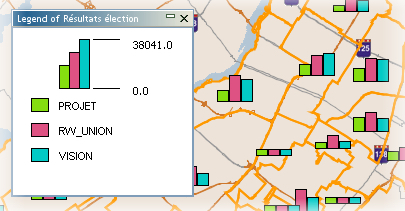
Bar charts thematics draw bar chart diagrams on the center of the elements they qualify. This type of thematic works with one or many numeric attributes. Each bar of the diagram is associated with a different attribute. The size of the diagram is proportional to the sum of the attribute values. Only numeric attributes can be used for this type of thematic.
The creation process is similar to creating a pie charts thematic, as described above.
Methods for calculating ranges
Several different methods can be used to calculate the ranges of values for the categories of thematics using classifications. These methods are described below.
| Method | Description |
|---|---|
| Equal ranges | The ranges will have equal sizes between the minimum and the maximum values (e.g. 0-10,10-20, 20-30). |
| Equal count | The range limits will be calculated so that an equal count of elements falls in each category. |
| Standard deviation | The range limits will be calculated so that the average value falls in the middle of the categories and each category range size is equal to the calculated standard deviation value. |
| Defined interval | The range size is user-defined and constant for all categories, starting from the minimum value, and adding the defined interval for each category. |
| Percent ranges | The range for each category is expressed as a percentage of the full value range (e.g. 4 categories with 20%, 20%, 35% and 25%). The total must be equal to 100%. |
| Custom ranges | All range limits are user-defined. |
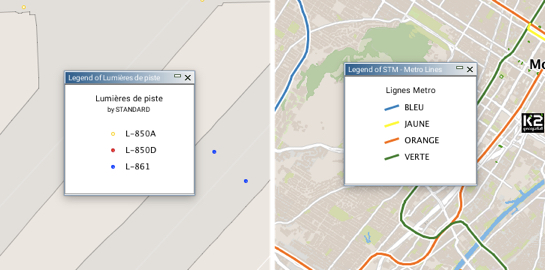
Once the thematic has been created, you are brought to the interface that displays its general information and that allows you to specify the legend, give titles to the classes, and edit or delete the thematic.
| Legend | |
|---|---|
| Legend title | Enter a title for the legend. |
| Legend subtitle | Enter a subtitle for the legend. |
| Dynamic legend | For classification thematics only. Select this option to make the legend dynamic. This type of legend is constantly refreshed to show only the classes that are visible on the map displayed. |
| Symbols in the legend | For proportional quantities thematics only. Select the number of symbols you want to display in the legend. The minimum is 2 symbols indicating the extreme values. |
Click on  to save the settings.
For classification thematics, you can unselect classes you do not want to display, and you can also give a title to each class. Click on to save the settings.
Enabling and disabling thematics
Enabled thematics are displayed automatically when the layer is displayed in JMap on the client. Disabled thematics are still available but are not displayed by default. They need to be enabled by the user to be displayed. You can enable and disable thematics from the thematics section in JMap Admin.
Reordering thematics
In JMap applications, thematics are displayed in the order they are defined in JMap Admin. It is important to set the order appropriately because some thematics can completely hide others if they are placed on top. Use the Modify menu from the list of thematics in order to modify their order.
Labels
In JMap, labels are text that is related to map elements. They are used to display information about the elements on the map. For example, you can use labels to display the city names for a layer of points representing cities.
Labels can either be placed manually using the labeling tool or generated automatically by JMap at display time. Depending on the type of elements of the layer, the labeling configuration section can slightly vary. The following figure shows an example of curved labels (left) and labels with a frame (right).
The following figure shows an example of of labels with a background symbol.
Labeling is configured by specifying text that defines the label’s content; this text can contain static parts, variable parts (functions) and JavaScript programs. At display time, functions are executed and replaced by the result. For example, the ElementValue(attrib)function (or ev(attrib), in its short form) will be replaced by the value of the corresponding attribute. JavaScript programs can be used to perform operations on attribute values. Label text can span multiple lines.
The functions supported by labels are the same as those supported by mouseover. For more information on these functions, refer to the Mouseover section.
| Labeling parameters | |
|---|---|
| Label text | The text of the label. Static parts will be displayed as is and ev(attrib) functions will be replaced by the corresponding bound attribute values. Unlike mouseover bubbles, labels don’t support HTML formatting or hyperlinks. See the following examples:Country: ev(country) Country: CanadaCity: ev(city) (ev(country)) City: Paris (France)Population: ev(pop) Population: 2150000Labels also support JavaScript programming to perform mathematical operations as well as operations on character strings using attribute values. The print function is used to print content in the label. Area: ev(area_km2) km2<script>var SQ_KM_IN_SQ_MI = 2.58998811;var area_sq_mi = ev(area_km2) / SQ_KM_IN_SQ_MI;print(area_sq_mi.toFixed(1) + " sq. mi");</script>leads to: Area: 91935.7 km2 31635.6 sq. mi |
| Label style | |
|---|---|
| Font | Select the font to use to display the labels. |
| Size | Select the size of the font. |
| Bold, Italic, Underline, Striked through | Select the font attributes. |
| Outlined | Select this option to display an outline around the label text. This makes it easier to read labels on the map. |
| Use antialiasing | Select this option to enable antialiasing. |
| Text color | Select the color of the label text. |
| Outline color | If the Outlined option is selected, choose the color of the outline. White is the default. |
Automatic labeling
Automatic labeling adds labels to map elements automatically, without user interaction. For each vector layer, you can enable or disable automatic labeling and define scales between which automatic labeling will be activated. It is often useful to set a minimum scale limit for automatic labeling to avoid overcrowding the map.
Also, in order to avoid overcrowding the map, three tools allow you to control the order or priority in the position or display of the labels: dynamic position, layer priority, and priority by attribute.
| Automatic labeling | |
|---|---|
| Automatic labeling | Select this option to enable automatic labeling. |
| Minimum scale | Minimum scale over which automatic labeling will be activated. |
| Maximum scale | Maximum scale under which automatic labeling will be activated. |
| Label position | The position of the label in relation to the map element is determined based on a grid, with nine possible positions. This position can be fixed or dynamic. Fixed: the label is always displayed at the selected position. This is the default option. Dynamic: this function allows you to display the maximum number of labels avoiding overlapping conflicts of labels. The position of the labels of the layer varies according to the relative priority established for each position of the grid. Possible values are: 0 Blocked, 1 High, 2 Medium, and 3 Low. The default value of the center position is 1. At first JMap attempts to place the label in the center position. If this position is occupied by another label, JMap places the label in another lower priority position (Medium or Low) to minimize conflicts. |
| Label offset | Enter an offset in X and Y to modify the position of the label text. |
| Layer priority | This parameter allows you to assign the layer a priority over other layers for displaying its labels. This priority is relative, depending on the other layers that are present. The available values, from lowest to highest priority, are the following: Normal, Above Normal, High, Very High, Maximum. For example, the labels of a layer with a High priority are displayed before the labels of a layer whose priority is lower (Normal or Above Normal). |
| Priority by attribute | This parameter allows you to assign a display priority to the elements of a layer based on the value of an attribute. This priority is relative and depends on the other elements that are present in the same layer. For example, in a road network layer in which road sections are categorized according to their importance, the labels of the most important sections have a higher display priority than the labels of the less important sections. The attribute can be numeric or alphanumeric, and it must be possible to organize the values in ascending or descending order. Check this option to select the attribute to use for the prioritization in the drop-down menu. This icon  is used to establish whether the priority gradient is in the ascending or descending direction of the values. is used to establish whether the priority gradient is in the ascending or descending direction of the values. |
| Allow labels overlapping | Allow the labels of one layer to overlap and to overlap the labels of other layers. This option overrides the global project setting that prevents label overlapping. This can be useful to ensure that all labels of this layer are displayed. |
| Prevent label duplication | Select this option to avoid having the same label text displayed many times. Useful for displaying street names. |
| Parse numeric labels | If label contains text and numbers, display only numeric values. Useful when you want to display only highway numbers using an attribute containing other text (e.g. “Highway 40” becomes “40”). |
| Oriented labels (along the line) | Only for line elements. Select this option to display the label text along the lines. |
| Curved labels | Only for line elements. Select this option to have the label text follow curved lines. |
| Proportional size | By default, label text is always displayed at the specified font size, independently of the scale of the map. Use this option to have the label text size adjusted proportionally to the scale of the map. The text will be displayed at its specified font size when looking at the map at the specified reference scale. When the scale of the displayed map is changed, the text size will be modified accordingly. |
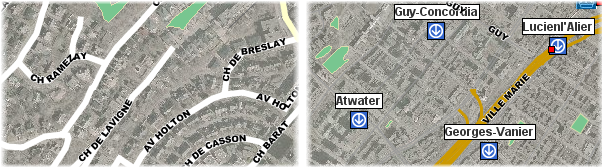
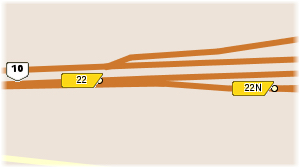
| Background symbol | Select this option in order to choose a symbol that will be displayed behind the label text. Note that the label text should fit in the selected symbol. This is used mainly for highway shields containing highway numbers. |
| Draw frame | Select this option to draw a frame around the label text. You can also select the color of the background of the frame as well as the color of its border. |
| Rotation | Select this option if you want the labels to have a rotation. Angle attribute: You can select a numeric bound attribute that contains the rotation angle of the text. The labels will follow this rotation. Rotation direction: If an angle attribute is used, select the direction of the rotation. |
| Follow map rotation | Select this option to have the labels rotated with the map if the user sets a map rotation. |
| Follow symbol position | Check this option if you want the labels to follow the symbol when an offset is applied to it. |
| Dynamic placement | Select this option to enable dynamic placement of the labels. This option allows you to enable or disable the dynamic placement settings you configured in the Label position section. |
Mouseover
Mouseover bubbles are meant to display information about the elements they are pointing to. This information includes text, attribute values, hyperlinks, images, etc. The JMap administrator determines what information is displayed in the bubbles of each layer.
The content of mouseover bubbles can be formatted using HTML tags. Mouseover bubbles can also contain JavaScript programs.
To configure mouseover for a layer, click on Mouseover in the details section of the layer.
| Mouseover | |
|---|---|
| Mouseover | Enter the content of the mouseover bubble. See sections below for an explanation of the syntax. |
| Background color | Select the background color of the mouseover bubble. |
| Prevent text duplication | Select this option to prevent the same text from being repeated many times within the same bubble. This can happen when pointing to many map elements on the same layer that have the same mouseover content (e.g. street segments at an intersection). |
| Minimum scale | Activate this option and enter the minimum scale from which the mouseover bubble must be displayed. |
| Maximum scale | Activate this option and enter the maximum scale from which the mouseover bubble must be displayed. |
Providing mouseover content
You must provide the text that will be used as the content of the bubble. This text can be comprised of static parts (displayed as is), variable parts (replaced at display time by another value), simple JavaScript programs, and HTML tags. For instance, the elementValue(city) function will be replaced at display time by the value of the city attribute for the pointed element.
Mouseover syntax
The mouseover syntax is comprised of various functions that will determine the content of the bubbles. Functions and their parameters are generally not case sensitive. For instance, ev(city) is equal to Ev(CITY).
The following table explains the various available functions:
| Function | Description |
|---|---|
| elementValue(attrib) or ev(attrib) attrib: the name of an attribute | Replaced by the value of the bound attribute whose name is passed as a parameter for the pointed element. For example, ev(id) will be replaced by the value of the id attribute for this element. |
| elementId() | Replaced by the element identifier. |
| polygonArea() | Replaced by the area of a pointed polygon type element. |
| lineLength() | Replaced by the length of a pointed line type element. |
| centroid() | Replaced by the coordinates of the geometric centroid of the element’s geometry. |
| format(attrib, format) attrib: the name of a date or numerical attribute format: the desired date format | Replaced by a number or date that was formatted according to a specific format. Example: format(date_insp, dd/MM/yyyy)where date_insp is the name of an attribute containing a date and dd/MM/yyyy is the desired date format, as indicated in the documentation of the java.text.SimpleDateFormat Java class. Example: format(attrib, ##0,00)where attrib is the name of an attribute containing a number and ##0,00 is the desired number format, as indicated in the documentation of the java.text.DecimalFormat Java class. |
| ifNull(attrib, value) attrib: the name of the attribute to test value: the value to display if attrib is null | Replaced by the value value only if the value of the attrib attribute is null. If the attribute value is not null, nothing is displayed. Example: ifNull(temp, N/A)Displays N/A if the value of the temp attribute is null. Example: ifNull(attrib_a, attrib_b)Displays the value of the attrib_b attribute if the value of the attrib_a attribute is null. |
| ifNotNull(attrib, value) attrib: the name of the attribute to test value: the value to display if attrib is not null | Replaced by the value only if the value of the attrib attribute is not null. If the attribute value is null, nothing is displayed. Example: ifNotNull(land_value, $)Displays only if the value of land_value is not null. |
| subString(attrib, startIx, endIx) attrib: the name of the attribute for which a part must be extracted. startIx: starting position in the character string. endIx: ending position in the character string. | Replaced by a portion of the value (as a character string) of the attrib attribute, between the startIx position and endIx position. Example: subString(name, 0, 5)Replaced by the first five characters of the name attribute value. If this value is Montreal, the mouseover will display Montr. |
| encode(attrib, encoding) attrib: the name of the attribute to code encoding: the name of the encoding | Replaced by the value of the attrib attribute once it is encoded with the specified character encoding (UTF-8, CP437, ISO 8859-1, etc). Example: encode(name, UTF-8)Replaced by the value of the name attribute encoded in UTF-8 characters. |
| <script> code JavaScript</script> | Runs the JavaScript code found between the tags. In JavaScript, the attribute values of the elements are accessible through the elementValue() or ev() function.Mathematical operations or character string operations can be performed on attribute values. To display content in the mouseover, the script must call on the print() function.Example: <script> print ( ev(population) / ev(area) ); </script>Calculates and displays the result of the value of the population attribute divided by the value of the area attribute. Example: <script>var KM_IN_MI = 0.621371;var dist_mi = ev(km) * KM_IN_MI;print('ev(osm_name)');print(dist_mi.toFixed(1) + " mi");</script>Converts the distance in kilometers contained in the value of the km attribute into miles. Displays the value of the osm_name attribute and the distance in miles with a decimal figure. |
| <a href=”download:file URL“>some text</a> | JMap supports a special hyperlink syntax that allows a user to download a file by clicking on the link. The file to download can come from a http: or a file: URL. Example: <a href="download:http://someserver/123/report.pdf">Download</a>Displays a link that can be used to download the report.pdf file from the web. Example: <a href="download:file://D:/123/report.pdf">Download</a>Displays a link that can be used to download the report.pdf file from a Windows file system folder. |
| photosAsThumbnails() | Replaced by smaller versions of the images attached to the element. The user can click on a thumbnail to open the full size image.photosAsThumbnails(title) photosAsThumbnails(date) photosAsThumbnails(title,date) With these options, the title and/or date will be displayed with each thumbnail. It is very important that you do not add any spaces between title, the comma, and date. |
| projectName() | Replaced by the name of the current project. |
| userName() | Replaced by the user code of the user that is currently connected. |
| sessionId() | Replaced by the identifier of the current session. |
| host() | Replaced by the name of the host or address of the JMap Server instance to which the application is connected. |
| port() | Replaced by the port number (http or direct) of the JMap Server instance to which the application is connected. |
| date() | Replaced by the current date and time. |
HTML content
The content of the bubble can be formatted using simple HTML tags. Mouseover bubbles do not support CSS or advanced tags such as <DIV>. The following HTML tags are supported and frequently used in mouseover:
<B>, <I>, <U>, <A>, <IMG>, <TABLE>, <BR>
You can insert hyperlinks in mouseover bubbles. These hyperlinks can be clicked, and they allow users to open HTML pages or to open or download files.
Examples
| Mouseover content | Display |
|---|---|
City : ev(CITY) A simple example of static text with the value of an attribute. | 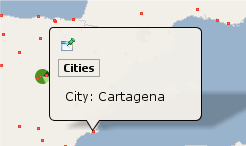 |
City: ev(CITY)(ev(COUNTRY)) Example containing static parts and displaying 2 attribute values on 2 lines. | 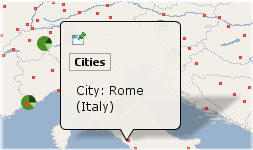 |
ev(STATION_NAME)<a href="ev(URL)">Site web</a>An example of basic formatting using HTML tags and a hyperlink where the URL comes from the value of the URL attribute. | 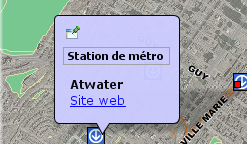 |
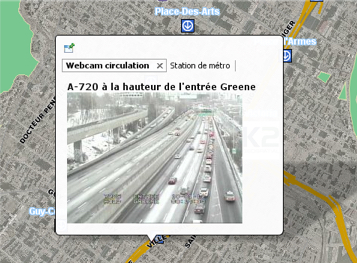
<b>ev(DESCRIPTION)</b><img src="ev(IMAGE_URL)" height="175" width="234" />An example of an HTML tag that takes the image URL from the value of the IMAGE_URL attribute. | 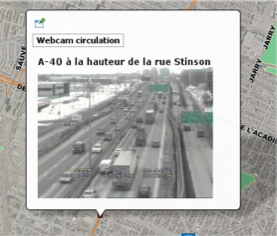 |
Area : ev(AREA_KM2) km2 <script> var SQ_KM_IN_SQ_MI = 2.58998811; var area_sq_mi = ev(AREA_KM2) / SQ_KM_IN_SQ_MI; print(area_sq_mi.toFixed(1) + " sq. mi"); </script> An example of a <script> tag with JavaScript code. The value of the AREA_KM2 attribute is converted from square kilometers to square miles. | 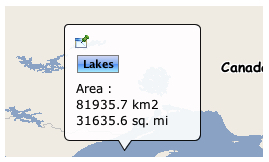 |
<table style="border:3px solid black; border-radius:5px; background: #1fc8db; color:white"> <thead> <tr> <th style="padding: 5px" class="">Name</th> <th style="padding: 5px" class="actions">FirstName</th></tr> </thead> <tbody> <tr> <td style="padding: 5px" class="">Gratton</td> <td style="padding: 5px" class="actions">Bob</td> </tr> </tbody> </table> An example of formatting with a style attribute. | 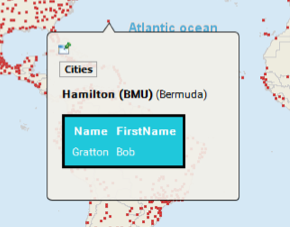 |
Locating map elements or coordinates using mouseover
Mouseover supports a function to locate map coordinates or elements using a special URL syntax. A hyperlink is displayed in the bubble, and when it is clicked, the map locates the specified element(s) or region. This function is only available in JMap Pro.
| Mouseover locate example | Description |
|---|---|
<a href="locate:region;-73;45;5;5">Locate</a> | Displays a Locate hyperlink. When clicked, locates the region defined by x=-73, y = 45, width = 5, height = 5 in the same map. This is expressed in the map’s units. |
<a href="locate:object;subway;name;'atwater'">Locate</a> | Displays a Locate hyperlink. When clicked, locates the elements on the subway layer that have their attribute name equal to atwater in the same map. |
<a href="locate:object;subway;name;'a%'">Locate</a> | Displays a Locate hyperlink. When clicked, locates the elements on the subway layer that have their attribute name starting with letter a in the same map. |
<a href="locate:object;subway;name;'atwater';1000">Locate</a> | Displays a Locate hyperlink. When clicked, locates the elements on the subway layer that have their attribute name equal to atwater in the same map. The resulting map has a scale of 1 : 1000. |
<a href="locate:object;subway;name;'atwater':target=Result">Locate</a> | Displays a Locate hyperlink. When clicked, locates, in a new map called Result, the elements on the subway layer that have their attribute name equal to atwater. If a map called Result already exists, it is reused. If the name of the map was new, a new map (with an automatically generated name) would be created each time. |
Using a URL to display content
You can specify a URL that opens an HTML page to display in the mouseover bubble (only supported in JMap Pro). The HTML page will occupy 100% of the bubble. The syntax is as follows:
$URL{http://awebsite.com}
The specified URL can be static or it can come from an attribute. It can also use attribute values as parameters, as shown below:
$URL{http://awebsite.com?param1=ev(ATTRIB_A)¶m2=ev(ATTRIB_B)}
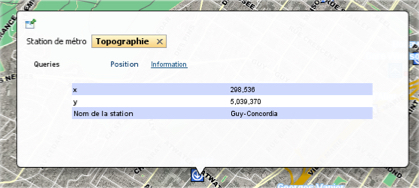
Information Reports
Information reports are used to display descriptive information regarding map elements. These reports can display attributes extracted from the underlying spatial data source or information from databases outside JMap. Each layer can have zero, one or more reports. The information reports are presented as web pages or PDF documents.
To configure reports for a layer, click on Reports in the layer’s details section.
The reports section shows the list of existing reports for a layer. In JMap applications, reports are presented in this order. You can change the order using the arrows. To create a new information report, press Create. To delete a report, press Delete.
Creating a report
There are three different types of reports: Basic, Advanced and Custom.
Basic
Basic reports are generated as web pages. They contain features to be printed and exported in Excel. Tables containing the values can be sorted by clicking on the column headers. You can also configure the names of the fields to be displayed in the reports.
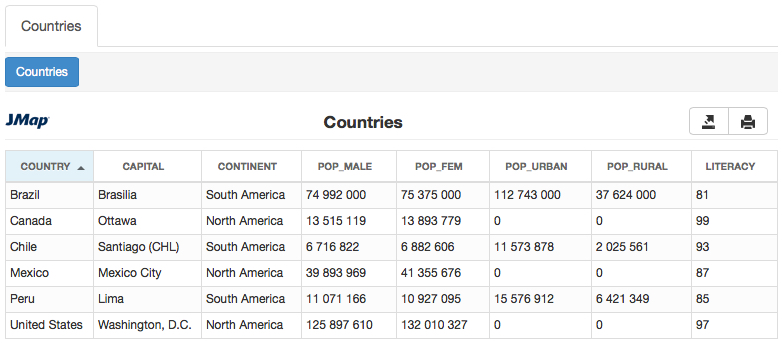
| Configuration | |
|---|---|
| Title | The title of the report. |
| Extract data from | Current layer: Obtain report data directly in the layer attributes. Refer to Report data sources - Current layer. External database: Obtain report information from an external database connected to JMap. The database must contain a field that links to an attribute of the layer. Refer to Report data sources - External database. |
| Template (single) | Template used for reports on a single map element. |
| Template (multiple) | Template used for reports on multiple map elements. |
| Attributes | |
|---|---|
| Title | Text to be displayed in the report instead of the attribute name. |
Advanced
Advanced reports are based on the BIRT reporting tool (http://www.eclipse.org/birt/). A default report template is provided with JMap. You can also use the BIRT report Designer application to create custom reports or to edit the template provided in order to adapt it to your needs (add a logo, change the colors, etc.). For more information on report development, visit the BIRT website (http://www.eclipse.org/birt).
Reports can be generated in HTML or PDF format. Geographic map integration is also supported.
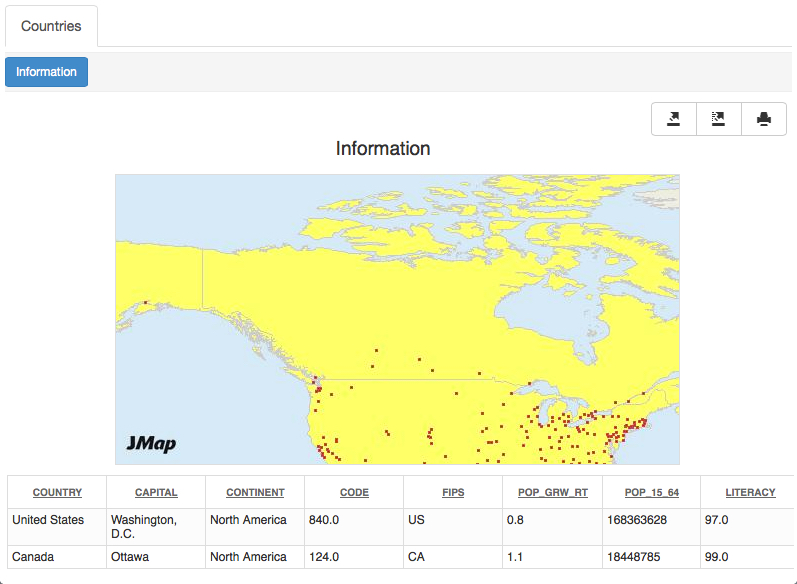
| Advanced reports | |
|---|---|
| Format | HTML: The report is generated as a web page. Tools allow you to export and print the report’s content. If the report is created for multiple map elements, its content can be sorted by clicking on the column headers. PDF: The report is generated in PDF format. This format is better suited for printing because the page layout is better. However, the content of this type of report is more static compared to the HTML report. |
| Title | The title of the report. |
| Extract data from | Current layer: Obtain report data directly from layer attributes. Refer to Report data sources - Current layer. External database: Obtain report data directly from an external database connected to JMap. The database must contain a field that links to an attribute of the layer. Refer to Report data sources - External database. |
| Template (single) | Template used for reports on a single map element. Two templates are available: inforequest.rpttemplate: Basic template containing a table, arranged vertically. inforequestMap.rpttemplate: Similar to basic template but also contains a geographic map. Refer to Report templates (Advanced reports). |
| Template (multiple) | Template used for reports on multiple map elements. Two templates are available: selectionreport.rpttemplate: Basic template containing a table, arranged horizontally. selectionreportMap.rpttemplate: Similar to basic template but also contains a geographic map. Refer to Report templates (Advanced reports). |
Report templates
With advanced reports, you can choose the report template you wish to use. By default, two templates are provided with JMap: a basic report template and a report template with an integrated geographic map. Each one of these templates is also available in two versions: one version is for a single element and the other is for a selection of multiple elements. You can create your own report templates based on the existing templates and add them to those provided by JMap. You can then select your templates to configure reports. The report template files (.rpttemplate) are placed in the JMAP_HOME/applications/templates/reports directory. Your templates must be placed in the single or multiple sub-directory, depending on whether they are in single element or multiple element version.
Custom
Custom reports are external to JMap and can be called using a URL. These reports can come from reporting tools (e.g. Crystal Reports, Jaspersoft, etc.) or from simple web pages.
A special syntax allows you to format the parameters to be passed in order to open the report.
| General information | |
|---|---|
| Title | The title of the report. |
| Report URL | Enter the URL that will allow you to open the external report. You will probably have to pass certain parameters in the report URL to identify the elements for which you wish to open a report. The parameter values usually come from the bound attributes of map elements. A special syntax is used to format the parameters. For example, if your report must be called by this URL: http://myserver/reports/myreport?id=3then, if the 0 attribute contains the parameter values, the following syntax must be used: http://myserver/reports/myreport?id=%0 However, if your report can include information on a selection of multiple map elements, the parameter syntax can take one of two different forms. If your report must be called by the following URL: http://myserver/reports/myreport?id=3,4,5then, if the 0 attribute contains the parameter values, the following syntax should be used: http://myserver/reports/myreport?%param[%0,’id’,’,’] This syntax uses the expression %param[Attribute, Parameter, Separator]. If your report must be called by this URL: http://myserver/reports/myreport?id=3,id=4,id=5then, if the 0 attribute contains the parameter values, the following syntax should be used: http://myserver/reports/myreport?%param[%0,’id’] This syntax uses the expression %param[Attribute, Parameter]. It is also possible to include other variables to compose the URL, such as %f, %p, %u, %h, etc. Refer to Supported variables for more information. |
Supported variables in the URLs of custom reports
| Variable | Display |
|---|---|
| %n | Replaced by the corresponding bound attribute value for the element. For example, %0 refers to the 1st bound attribute, %1, to the second one, etc. |
| %f | Replaced by a formatted number or date. There are 2 possible formats:%f[%n^D^dd/MM/yyyy]where %n refers to an attribute containing a date, D indicates that we want to display a formatted date and dd/MM/yyyy is the format pattern, as indicated in the Java class java.text.SimpleDateFormat documentation.%f[%n^N^##0,00]where %n refers to an attribute containing a number, N indicates that we want to display a formatted number and ##0,00 is the format pattern, as indicated in the Java class java.text.NumberFormat documentation. |
| %p | Replaced by the currently opened project name. |
| %u | Replaced by the name of the user currently logged in. |
| %s | Replaced by the current session id. |
| %h | Replaced by the host name or address of the JMap Server instance the client is connected to. |
| %o | Replaced by the port number (http or direct) of the JMap Server instance the client is connected to. |
| %t | Replaced by the current time (date and time). |
Report data sources
Basic and advanced reports can take their data from layer attributes or from an external database connected to JMap.
Current layer
Select the Current layer option to create a simple report that will only query the layer attributes (read below for the External database option). Afterwards, select the attributes to include in the report using the check boxes. Only the selected attributes will be displayed to the user; the others will be excluded from the report. Lastly, you can specify titles for the attributes; these will be displayed to the user instead of the actual attribute names.
External database
Selecting the External database option will instruct JMap to display information taken from another database, instead of the layer. This option allows you to query any database that has a field corresponding to one of the layer’s attributes.
| Attributes | |
|---|---|
| Database | Select the database from which the report data will be extracted. The database to query must have been configured in JMap Admin beforehand. |
| SQL query | Enter the SELECT SQL query that will be used to extract the data from the database. This query can have several tables. The query must include the key field used to join with a layer attribute.Afterwards, you must click on Execute in order to execute the query once. |
| Join fields | |
|---|---|
| Table | Select the table containing the join field. |
| Field | Among the fields in the selected table, select the field that will be used to join with the layer. |
| Attributes | Select the layer attribute that will be used to join with the data from the database. |
Captions
For reports that take their data from an external database, you can define the names of the fields to be displayed in the report, instead of using the field names in the database. Click on Captions to define these field names.
Bulk editing a layer set
You can edit different settings for a set of layers. You must select the layers to modify in the List tab of the Layers section of the project. Afterwards, press the Update button, and click on the Bulk edit… option. The Bulk edit interface will open.
| Update - Bulk edit… | |
|---|---|
| Change ‘Antialiasing’ | Check if you want to change this setting. Check New Value to enable the antialiasing feature. Uncheck New Value to disable the antialiasing feature. The Style section provides details on this parameter. |
| Change ‘Minimum scale’ | Check to change the minimum scale for displaying layers. Check Infinity or 1: and in this case, indicate the scale. The General Settings section provides details on this topic. |
| Change ‘Maximum scale’ | Check to change the maximum scale for displaying layers. Check Zero or 1: and in this case, indicate the scale. The General Settings section provides details on this topic. |
| Change ‘Request mode’ | Check to change the data request mode. Check the option of your choice. The Creating Layers section provides details on this topic. |
| Change ‘Description’ | You can write a new description for the layers. |