Map settings allow you to define map display options, such as rotation, units, use of a north arrow, and so forth. Map settings can be accessed from the map's pop-up menu (right-click on map).
General

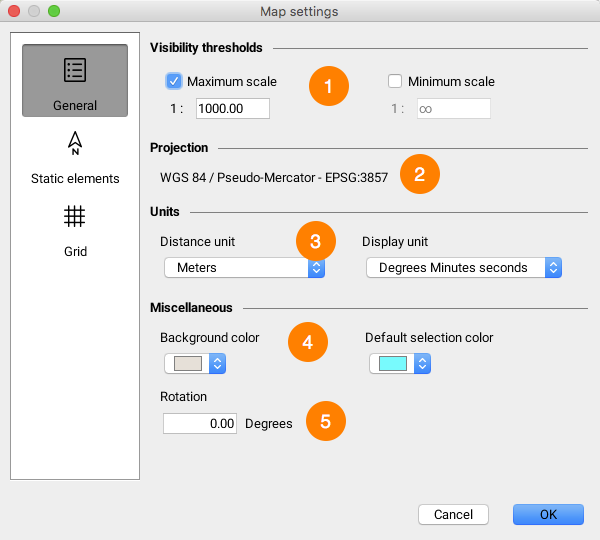
General map settings interface
1 |
Scale limits are used to limit the map's display scale. This prevents users from zooming too far in or out. • Maximum scale: Maximum scale limit for zooming in on the map. • Minimum scale: Minimum scale limit for zooming out on the map. |
2 |
Application's map projection system. |
3 |
Select units used on the map. • Distance unit: The distance unit is used to display all distance-related values (measurements, zoom level, etc.). • Display unit: Unit used to display map coordinates. |
4 |
• Background color: Select background color for map window. Background color appears wherever there is no visible data. • Default selection color: Select default selection color. Selected objects will be of this color unless a different selection style is defined for their layer. |
5 |
Enter rotation used to display map, in degrees. Rotation is performed clockwise. |
Static elements
Static map elements are objects that are placed on fixed areas of the map. Two types of static elements are available: the north arrow and graphic scale.

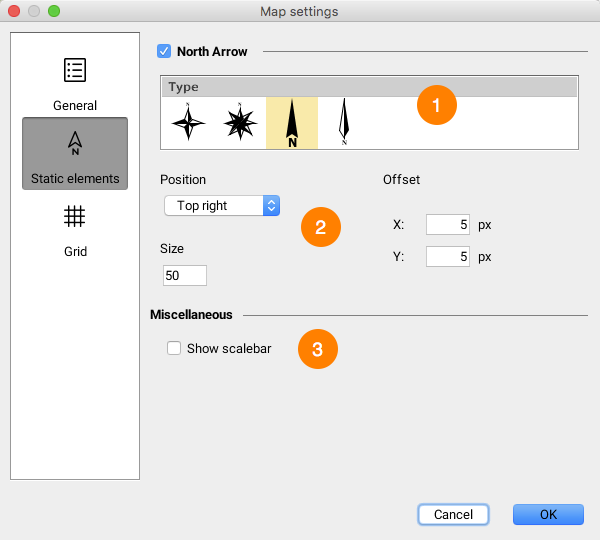
Interface for configuring map static elements
1 |
Select the North Arrow option to enable the display of the north arrow on the map. Afterwards, select the arrow model you wish to use. If the map is rotated, the north arrow will indicate this rotation. |
2 |
Select the arrow's position on the map. You can also offset the arrow from the chosen position by entering values in pixels. In addition, the size of the arrow can be adjusted. |
3 |
Enable the graphic scale to be displayed by selecting this option. |
Grid
A grid can be added to the map. This grid shows divisions and subdivisions of the coordinates system.

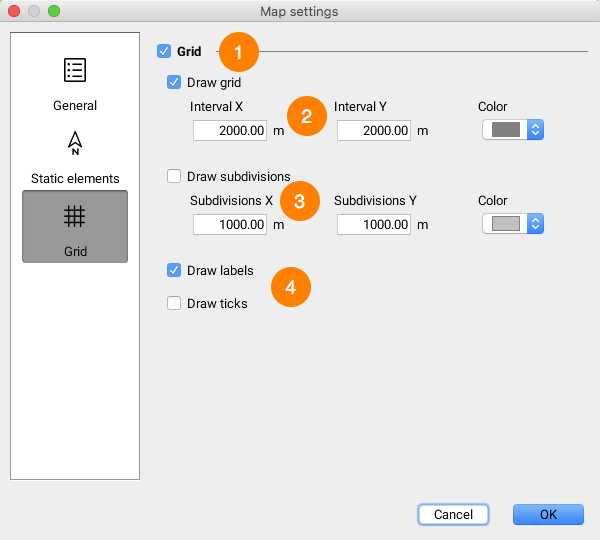
Grid configuration interface
1 |
Activate the grid. |
2 |
Select this option to have the grid show the division lines. Specify the X and Y intervals between the lines in the grid. You can also select the color of the division lines. |
3 |
Select this option to have the grid show the subdivision lines. Specify the X and Y intervals between the subdivision lines. You can also select the color of the subdivision lines. |
4 |
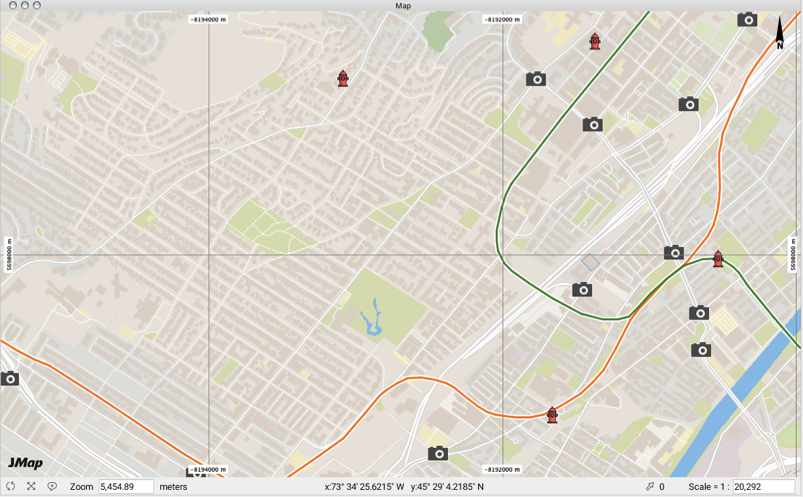
You can add labels indicating the grid's coordinates and ticks on the edges of the grid (view image below). |

Example of a map with a grid