The Data
Table of contents
- The Layers panel
- The card of a layer
- Displaying layers
- Thematics
- Thematics management
- Information
- Displaying the geographic extent of the layer
- Filter elements on the map
- Making layer elements selectable
Project data is organized into layers. Each layer contains data related to a specific theme. Layers are superimposed on one another to form the map that is displayed in the interface.
Some layers are comprised of objects or elements that are represented using a type of geometry (points, lines, polygons) and descriptive attributes. For example, a layer can represent trees using points, and the attributes associated with them can include the species of tree, diameter, height, and state of health. Thus, each object (tree) of the layer has a geometry that is located in space and attributes that describe it.
Other layers are comprised of raster data (pixels) that form images, such as aerial photographs or satellite images.
Layers can be grouped hierarchically based on themes, such as urban planning, the environment, transportation, etc. A multi-level hierarchical structure makes it easier to work with projects when they contain many layers and different themes.
Some layers are called base maps because they provide a context to display the data layers. Interaction with base maps is limited to selecting the base map to be displayed in the application.
The Layers panel
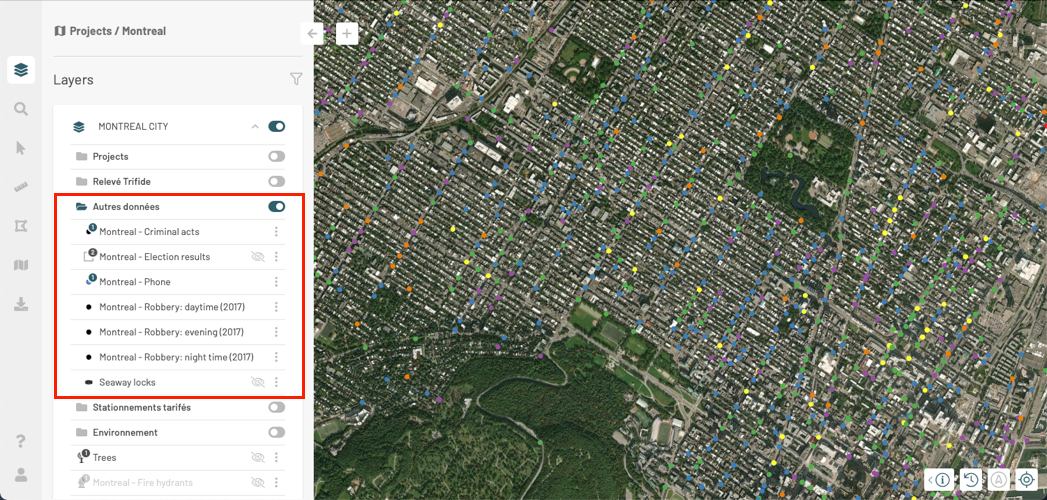
The Layers panel contains the details of the project’s layers and tools for different functions such as controlling the display or making the elements of a layer selectable.
-
Click on
 to open the Layers panel. The icon changes color
  .
.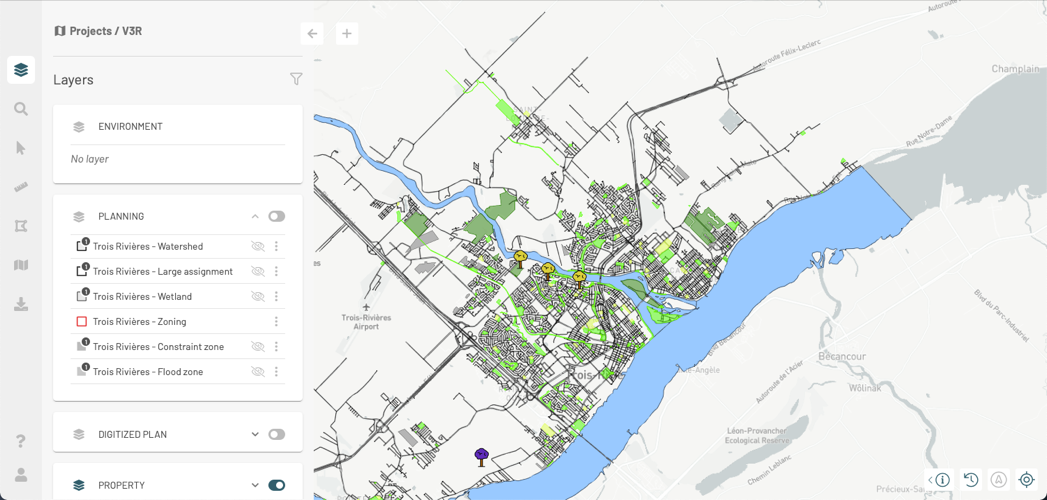
Within a project, groups of layers appear in the panel in the form of cards. A group can be opened to display its subgroups and layers, or it can be closed to show only its name.
-
Click on the arrow
 in the card of a group to open it. The subgroups and layers it contains will be displayed.
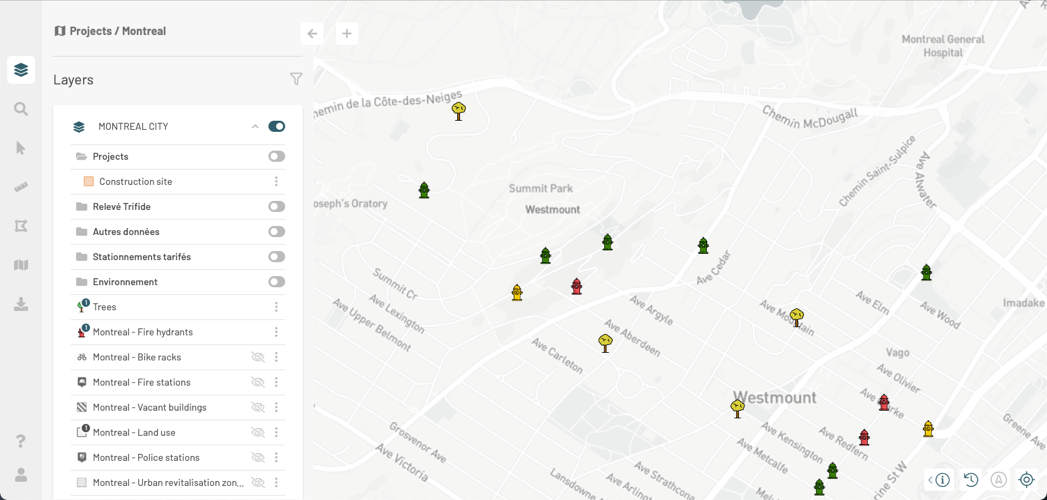
Each subgroup and layer has a card that presents different functions and details of the subgroup or layer. A subgroup is displayed using the
 icon, and a layer is displayed using an icon representing its style.
 -
Click on
to open the subgroup card and display the layers it contains. The icon changes to  , indicating that the subgroup has been deployed.
 -
Click on
to close the subgroup card. -
Click on
 to close the group of layers card.
 -
Pass the mouse over a layer to display the available tools. The card of a layer section offers details on these tools.
-
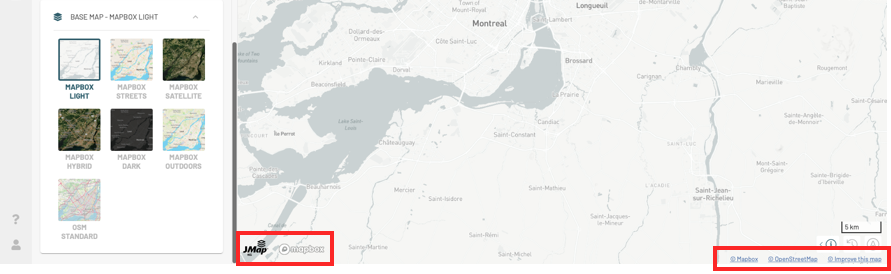
Select a base map from the BASE MAP group. The name of the selected map is displayed with the name of the group.
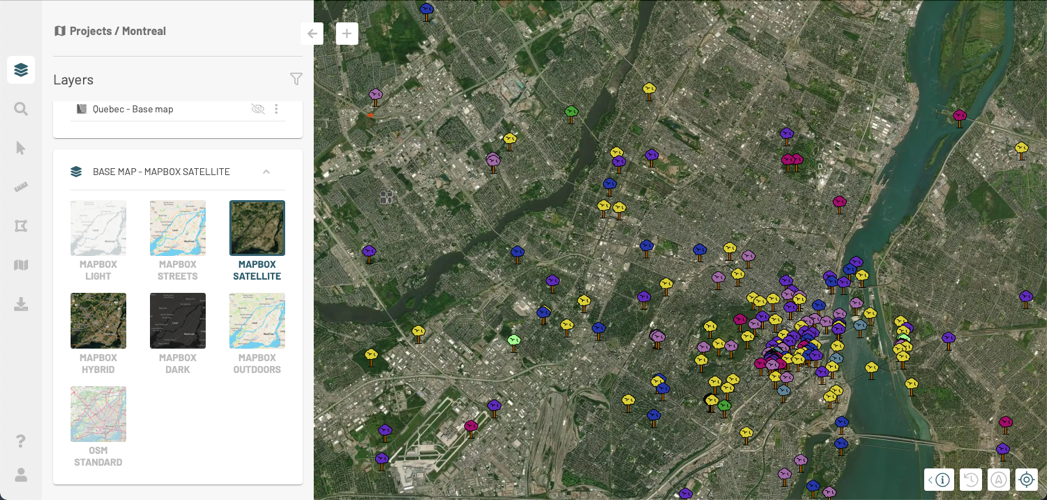
The base map attributions display at the bottom of the map.
To speed up the identification of the layers that interest you, you can apply a filter.
-
Click on
 to open the function Layer filters.
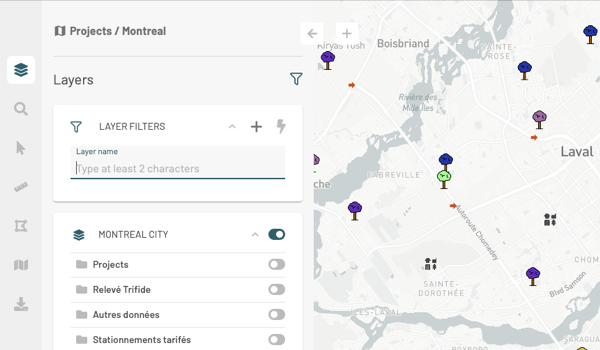
-
Enter characters in the range Layer Name to filter the layers based on their name.
-
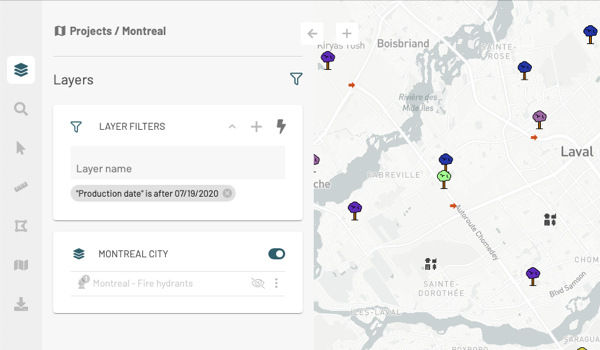
Click on
 to open the Add a filter card.
 -
Select the attribute from the Filter by list, the operator from the **Operator ** list, and the value by which you want to filter the layers.
-
Click Add. The filter is displayed in the Layer filters box. Only the layers that pass the filter are displayed in the Layers panel.
-
Click on
 to apply the filter to the map. Only the layers which pass the filter and whose display is activated are displayed in the map.
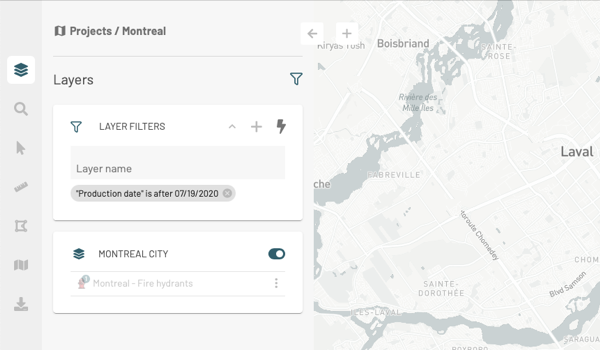
-
Click on
 to remove the layer filter. The layers appear in the Layers panel. You must turn on the display of layers to view them in the map.
The card of a layer
The card for each layer contains information such as the name of the layer, the presence of thematics, the presence of filters on the elements, etc.
To access the available tools, pass the cursor over the card of the layer you are interested in.
 | The icon of the layer reproduces its style, the appearance of the objects of the layer. The icon displays a number when a thematic is configured for the layer. The Thematics section offers details on this topic. |
| Arbres | Layer name. |
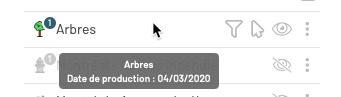
 | A small tooltip displays the name of the layer. If the layer has metadata (information about the data) it date of production displays in the tooltip. |
 | Filter: to display only those elements whose characteristics match the filter parameters. The Filter elements on the map section provides details on setting up and managing filters. |
 | Select: this tool make the elements of the layer selectable for editing, producing information reports, etc. The Making layer elements selectable section provides details on this topic. |
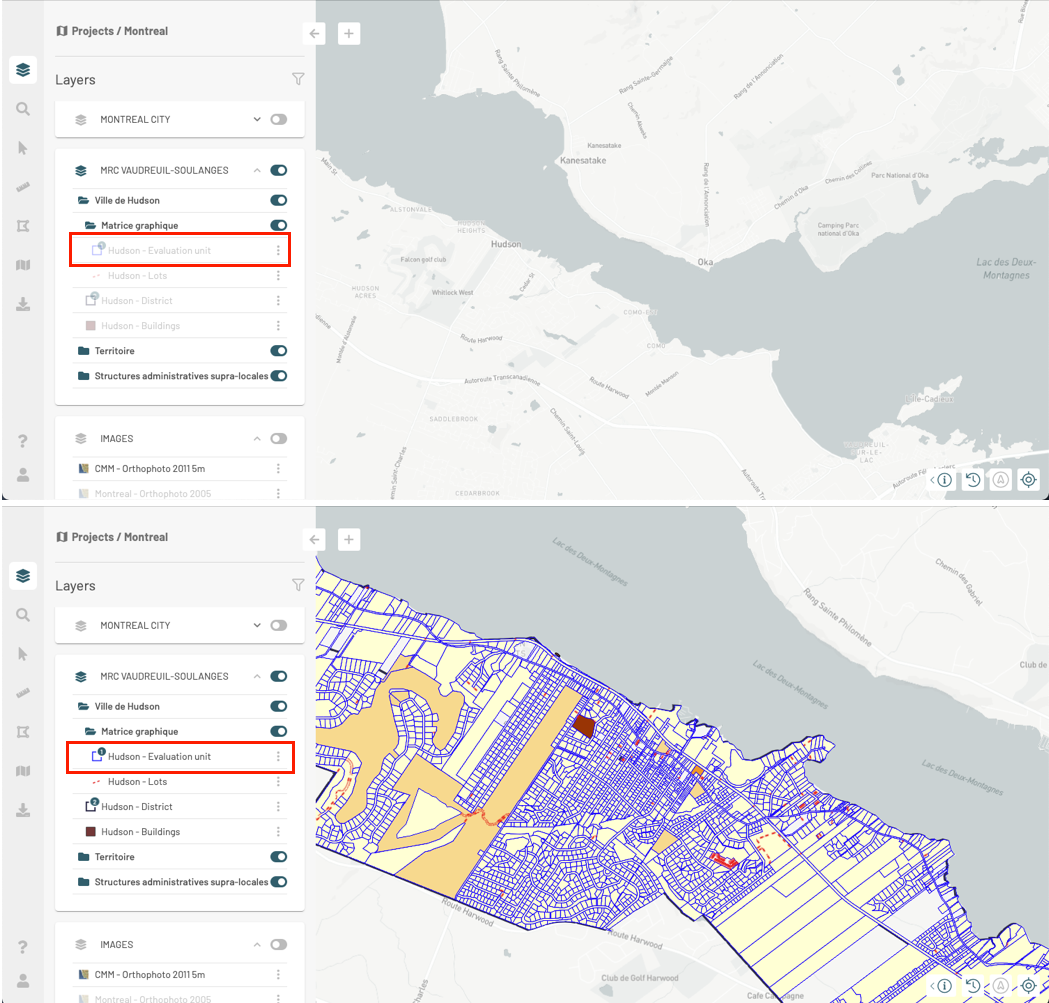
 / / | Display: to activate or deactivate the display of the layer in the map. The Displaying Layers section provides details on this feature. |
 | Menu: contains other functions: More information: the Information section provides details on this feature. More information: the Information section provides details on this feature. Thematic management: the Thematics management section provides details on this feature. Thematic management: the Thematics management section provides details on this feature. Zoom to layer extent: the Displaying the geographic extent of the layer section provides details on this feature. Filter elements on the map: The Filter elements on the map section provides details on this feature. Zoom to layer extent: the Displaying the geographic extent of the layer section provides details on this feature. Filter elements on the map: The Filter elements on the map section provides details on this feature. |
Displaying layers
You can select the layers to display in the map. To display a layer, you must display the group and the subgroups in which the layer is found.
-
Slide the switch on the group’s card from
 to
to  in order to enable the display of the group.
 -
Click on
to open the group card and display the layers and subgroups it contains. -
Slide the switch on the subgroup’s card to enable its display. The icon of the subgroup will change color
 .
.
The
icon appears in the layers’ cards whose display is disabled. No icon appears in layers’ cards whose display is enabled. -
Click on
to display the layer. The icon disappears, and the layer is displayed in the map.
-
To disable the display of a layer, bring the mouse pointer to the card of that layer. The
icon appears.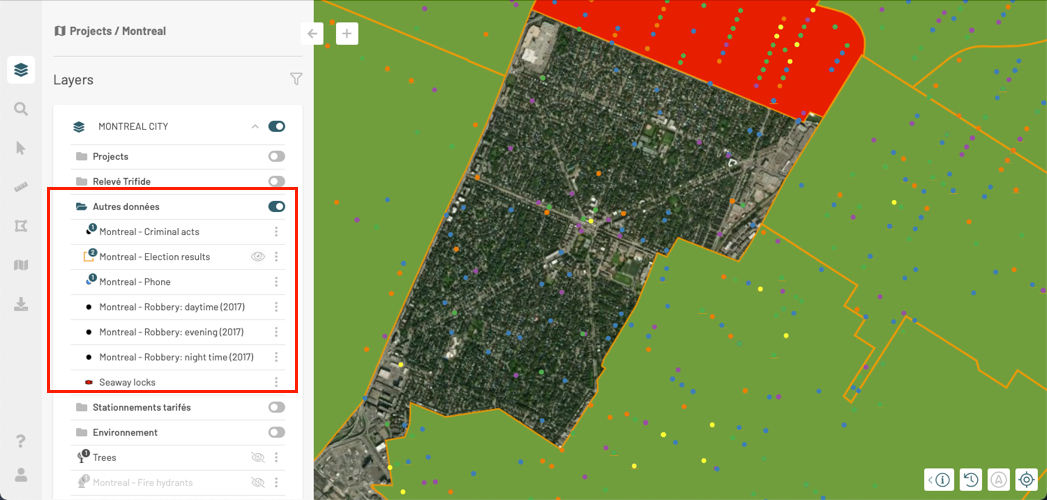
-
Click on the
icon, which turns to . The layer will no longer be displayed in the map. Its symbol will turn gray. -
Slide the display switch of the group
to this position if you wish to disable the display of all layers comprising this group. Even the layers whose display is enabled will no longer be shown.
Displaying layers based on the map scale
Some layers are configured to be displayed within a given scale interval. Displaying an abundance of small map elements when a small scale is selected (i.e. when the map displays a large territory with few details) can make it very difficult to read the map. Layers that have elements with these characteristics are usually displayed at a larger scale, when the map contains more details on a limited territory.
When a layer is not visible because of the map scale, its name and symbol will appear in very light gray. When you change the scale, these colors will become darker, indicating that the layer appears in the map if its display is enabled.
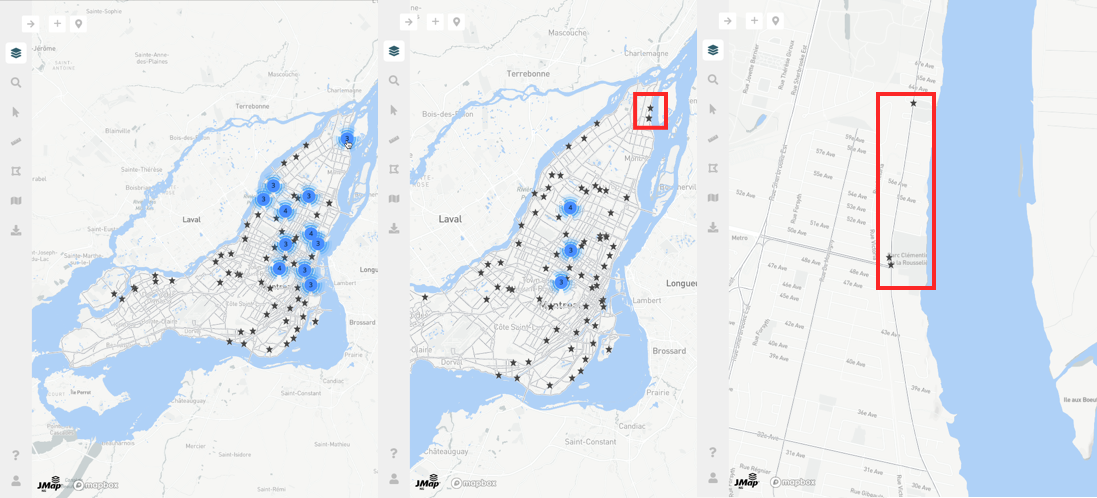
Clustering
Some layers whose elements are represented by points can display clusters of points. When points are close to each other on the screen, they are replaced by special symbols that graphically represent the clusters on the map and display the number of elements they contain.
If you change the scale of the map, the clusters vary in their location and number of elements:
-
Zoom in and out to view the variation in clusters on the map.
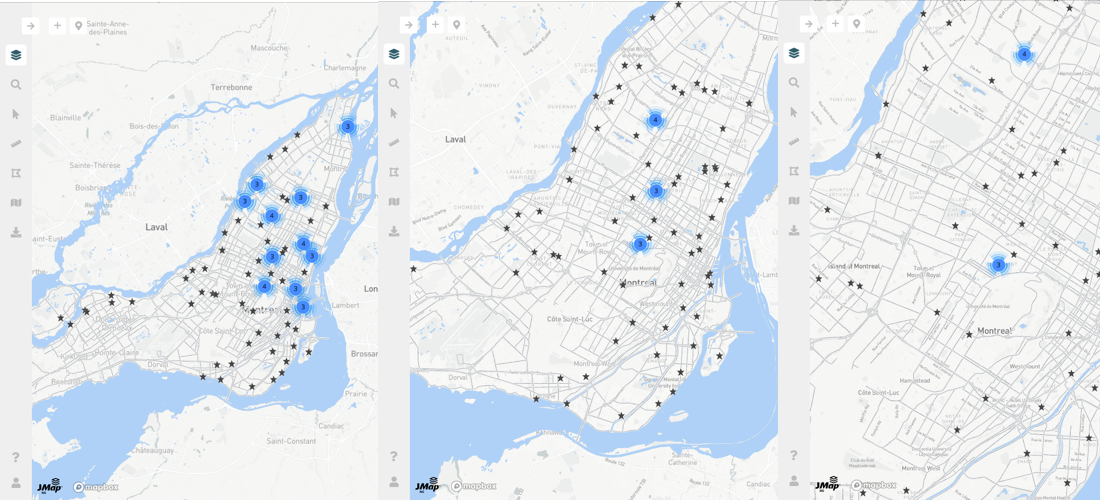
-
Click on a cluster. The map automatically zooms in to show in more detail smaller clusters and/or points that constitute the original cluster.
Thematics
Layers can have thematics, the appearance of that layer’s elements vary based on one or more attributes.
You can display more than one thematic for a layer at the same time.
To display the THEMATIC(S) panel of the layer, you have two choices:
-
Click the layer icon,
or
Click on
to open the menu and select Thematic management.The THEMATIC(S) panel displays the legend of the thematics.
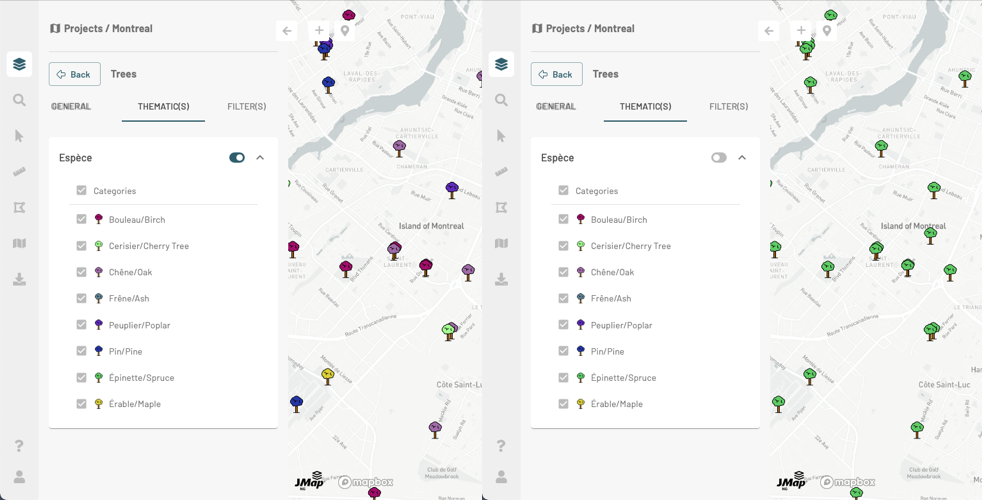
-
Use the switch to enable or disable each thematic. The appearance of the icons representing the layer’s objects will change according to your choice.
-
You can uncheck one or more classes or categories of the thematic so as not to display on the map the elements of these classes.
-
If the JMap administrator has configured it in this way, the thematic legend can be dynamic, i.e. the legend only shows the classes or categories of the elements displayed in the map. The classes of elements that are not displayed in the map are not shown in the legend. As you navigate the map, the legend changes depending on what is displayed there.
-
Click on
or to close or open the thematic’s card. -
Click on Back to return to the Layers panel.
Thematics management
This option is only available for layers that have thematics configured.
- Click on Thematic management to open the THEMATIC(S) panel and use the functions described in the Thematics section.
Information
To display layer information:
-
Click on
More information to open the GENERAL panel. Several information are presented there:-
Number of layer features that are visible on the map. The number varies as you navigate the map.
-
Extent: X and Y indicate the position of the southwest point of the layer, width and height indicate the layer extent in meters from this point.
-
Date of production: this is metadata.
-
Metadata: information about the data in the layer such as quality indicators, the organization producing the data, update dates, etc.
Metadata may be missing.
-
-
The Transparency function, available for raster data layers, allows you to adjust the transparency level between 0% (default) and 100%. The transparency level is saved when you save your map (Creating and Managing Customized Maps section).
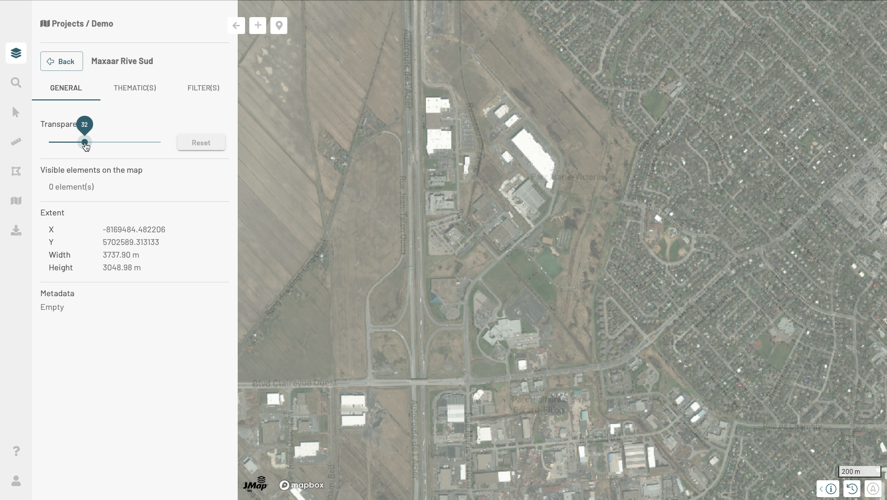
-
Click on the THEMATIC(S) and/or FILTER(S) tabs to display these panels.
-
Click Back to return to the Layers panel.
Displaying the geographic extent of the layer
To display the geographic extent of a layer, even if it is not displayed in the map:
-
Click on the
icon to open the menu. -
Click on
Zoom to layer extent. The map automatically displays the area corresponding to the extent of the layer. A rectangle delimiting the extent of the data is displayed for a few moments. -
Click on
 if you wish to return to the previous geographic extent.
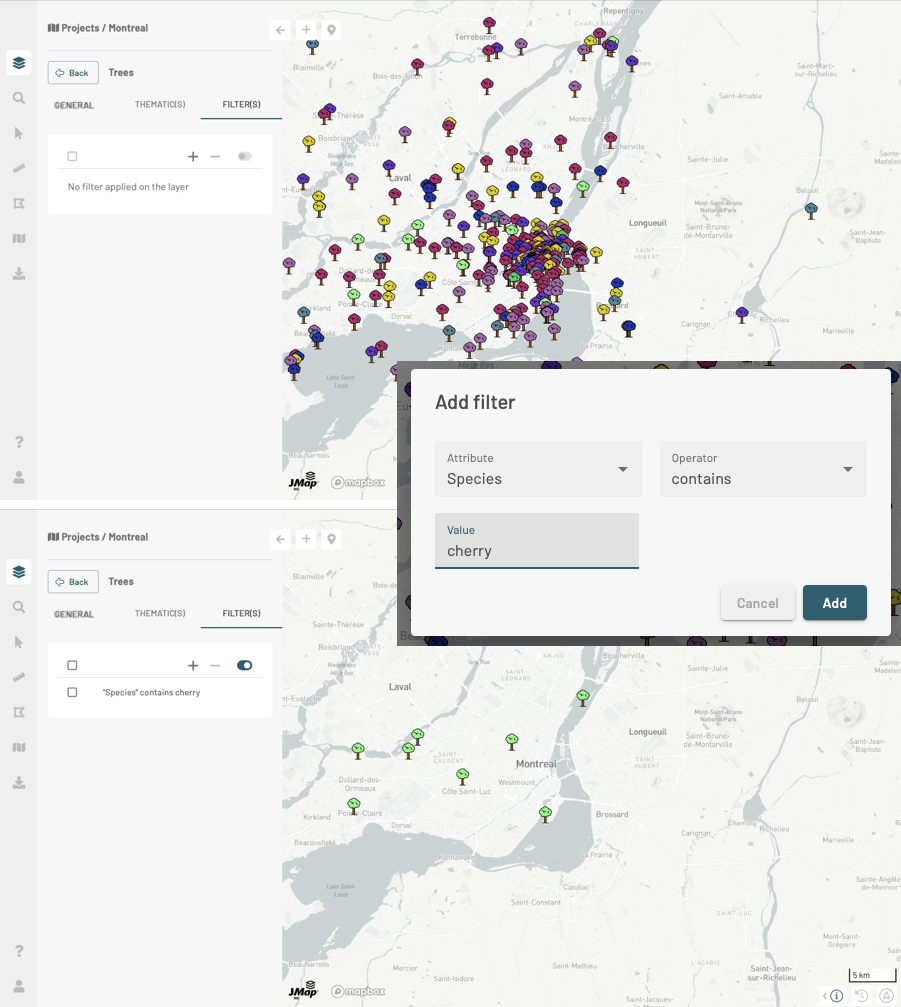
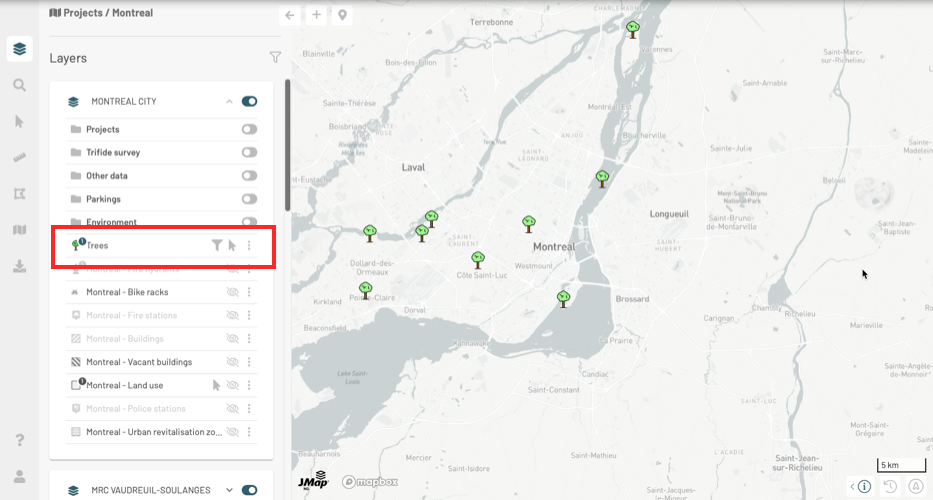
Filter elements on the map
You can configure filters to display only some elements of the layer. To configure and apply filters:
-
Click on
Filter elements on the map to open FILTER(S) panel. -
Click on
 to open the Add filter interface.
 -
Select the attribute, the operator and the attribute value(s).
-
Press Add. Only items in the layer that pass the filter are displayed on the map.
-
Click on the filter to open the Update Filter interface.
-
Click on
to add a filter. -
Check a filter to select it.
-
Click on
 to clear it or on
  to disable.
The icon  displayed in the layer card indicates that this one has an active filter. Configured filters are enabled by default.
Filter operators
equal to: This operator filters a layer’s elements to display the elements whose attribute value (regardless of its type) is equal to one of the values selected by the user.
not equal to: This operator filters a layer’s elements to display the elements whose attribute value (regardless of its type) is different from the values selected by the user.
contains: This operator filters a layer’s elements to display the elements whose attribute value (text) contains the value selected by the user.
is empty: This operator filters a layer’s elements to display the elements whose attribute (text) does not have a value.
is not empty: This operator filters a layer’s elements to display the elements whose attribute (text) has a value.
is null: This operator filters a layer’s elements to display the elements whose attribute value (regardless of its type) is null.
is not null: This operator filters a layer’s elements to display the elements whose attribute value (regardless of its type) is not null.
Making layer elements selectable
To perform certain functions such as editing data or interactively selecting elements of a layer using the selection tools, you must first make the elements of the layer selectable.
-
Pass the cursor over the card of the layer you are interested in to display the icon
. -
Click on
to make the layer elements selectable. The  icon is permanently displayed in the form.
 -
Click on
to make the elements of the layer non-selectable. The icon stops displaying and when you pass the cursor over the card, the icon appears.