You can analyze data on the activity of mobile units to produce thematic maps that are easily interpretable.
The JMap administrator configures all the details of the analyses that are available to you and that you can customize and display in the application.
Some of these analyses are based on a road network. These will offer information on the routes traveled by mobile units over a given period of time, for instance. Other analyses do not require a road network and instead use the geopositioning data of mobile units.
The road network on which the analysis is based may not be accessible to you, depending on the configuration set by the JMap administrator. It may also be a double road network, in which each traffic direction is indicated using a different line. This type of road network representation is necessary when the activity of a mobile unit involves only one traffic direction, as is the case for snow removal or road cleaning activities.
Analysis results are layers that display in the application's layer manager. These vector layers can be used to elaborate spatial requests, to perform spatial analyses (to create buffer zones, for instance), or they may be exported using the Exportation extension.
To perform analyses, you must start by defining a period of time for the analysis in the Mobile units tab of the Tracking window. The details are presented in the section Defining a period of time for data selection.
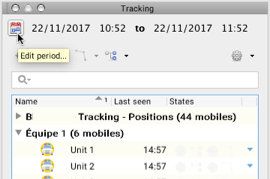
You can define static or dynamic periods for your analyses. The first option is useful for performing a posteriori analyses on how the activities were conducted, whilst the second type of analysis allows you to view results almost in real time, as the activity is being carried out.
Analyzing the activity of a mobile unit
1.Click on  to open the functions menu of the mobile unit whose activity you wish to analyze.
2.Click on Analysis  to enable the function. The Analysis symbol
  displays in the State column.
3.Click on the Analysis function's button in the Tracking window. A menu showing the available options appears.
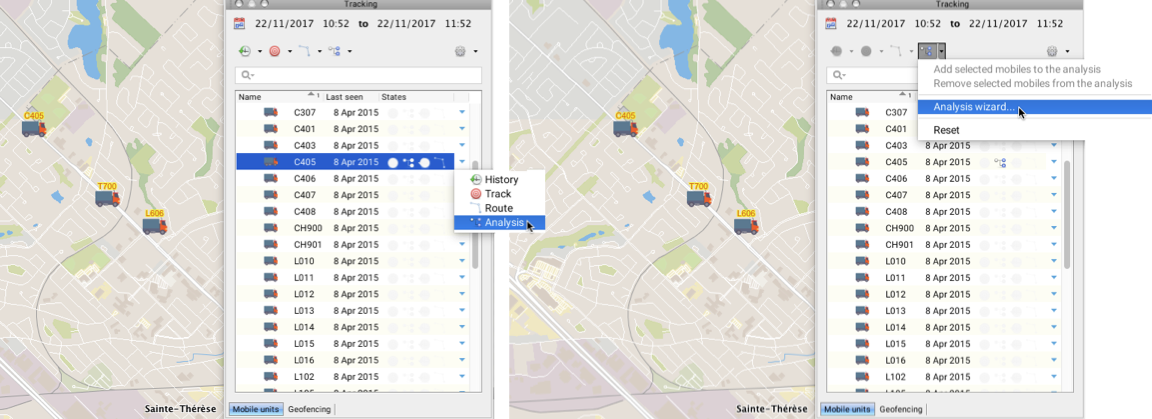
4.Select Analysis wizard....
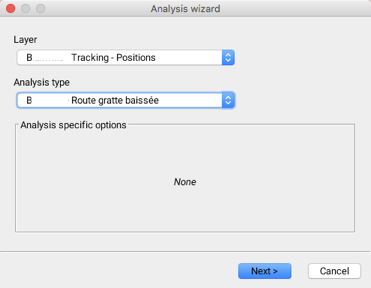
The Layer parameter allows you to select the Tracking layer on which you wish to perform the analysis. In this case, you have already selected the layer because you have selected the mobile unit.
The Analysis type parameter allows you to select the analysis you wish to perform. Some types of analyses have specific options you must configure.
A few examples of analysis types are presented afterwards. The list may vary based on the types of analyses configured.
Road traveled analysis
1.Select the Road traveled analysis type. This analysis does not require you to configure specific options.
2.Click on Next. An interface displays, allowing you to select the layer's mobile units. You can add other mobile units to your analysis.
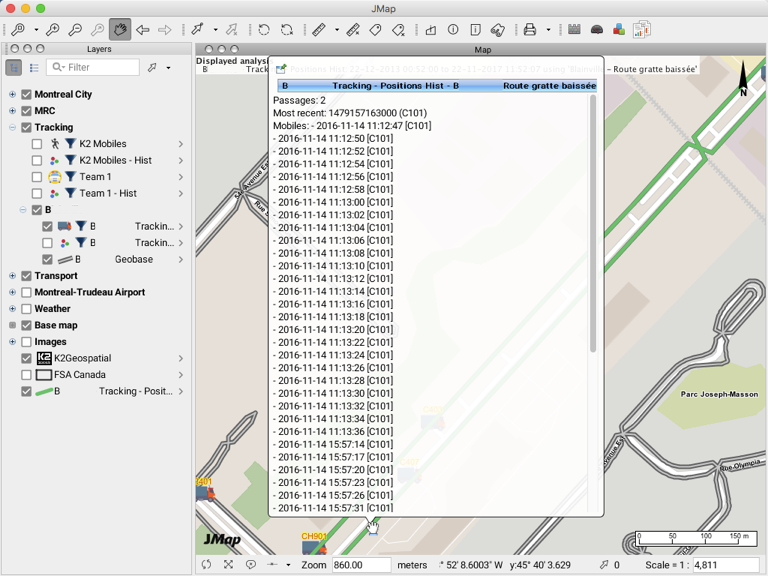
3.Click on Finish. The result of the analysis is displayed in the map interface. It consists of the road network sections covered by the mobile unit during the specified period.
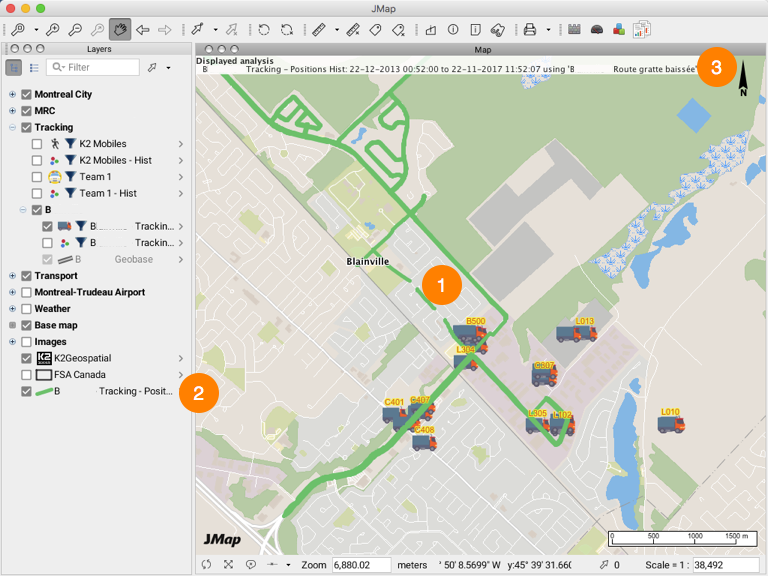
1 |
Route covered by the mobile unit, displayed in the map interface. |
2 |
Layer containing the route covered by the mobile unit in the Layer manager. You can customize the layer's parameters if you have the appropriate permissions, similarly to the application's other layers. |
3 |
A title in the header of the map interface displays the details of the analysis. |
You can also configure mouseover bubbles displaying the positioning data of the mobile unit over time.
Passages plow down analysis
1.Select the Passages plow down analysis type. This analysis provides information on the activity of plows used for snow removal operations.To perform this analysis, you must determine the time elapsed between two passages, i.e. the minimum time frame to consider that the truck made two separate passages.
2.Click on Next. An interface displays, allowing you to select the layer's mobile units. You can add other mobile units to your analysis.
3.Click on Finish. The result of the analysis is displayed in the map interface.
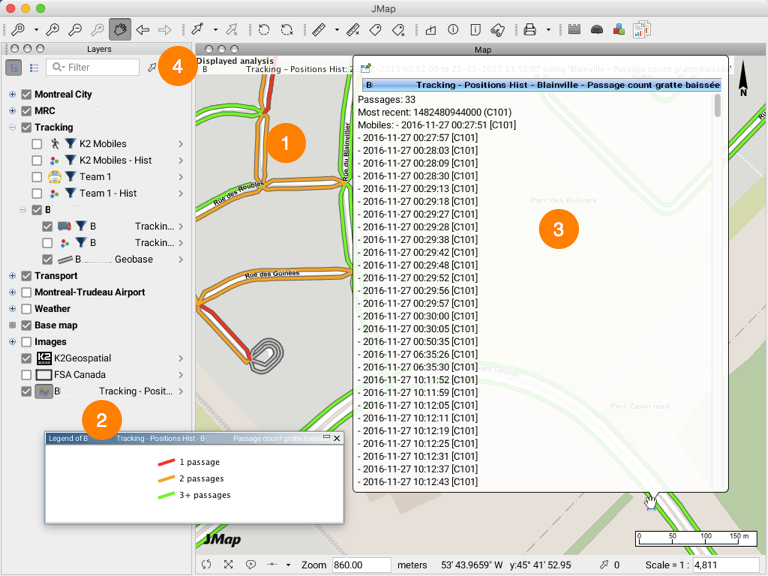
1 |
Route covered by the mobile unit, displayed in the map interface. Using a double road network allows you to analyze the passages of a mobile unit independently for each traffic direction. |
2 |
Layer containing the route covered by the mobile unit in the Layer manager. A thematic automatically displays, indicating if the mobile unit made one, two, or three or more passages for each section of the road network. You can customize the layer's parameters if you have the appropriate permissions, similarly to the application's other layers. |
3 |
A title in the header of the map interface displays the details of the analysis. |
4 |
You can also configure mouseover bubbles displaying data on the passages of the mobile unit over time. |
Analysis on the spreading of products
1.Select the option Épandage avec blasts. This analysis provides information on the regular spreading of abrasives as well as blasts, in the context of snow removal operations on roads. The other types of analyses either cover the spreading of products, or blasts. Given their configuration, these analyses do not require a road network because the route of a mobile unit is determined based on its geopositioning data. The driver indicates when the spreading or blasting begins and when the activity is finished. Using the vehicle's GPS data at those moments, it is possible to track its route.
2.Click on Next. An interface displays, allowing you to select the layer's mobile units. You can add other mobile units to your analysis, if they are available.
3.Click on Finish. The result of the analysis is displayed in the map interface.
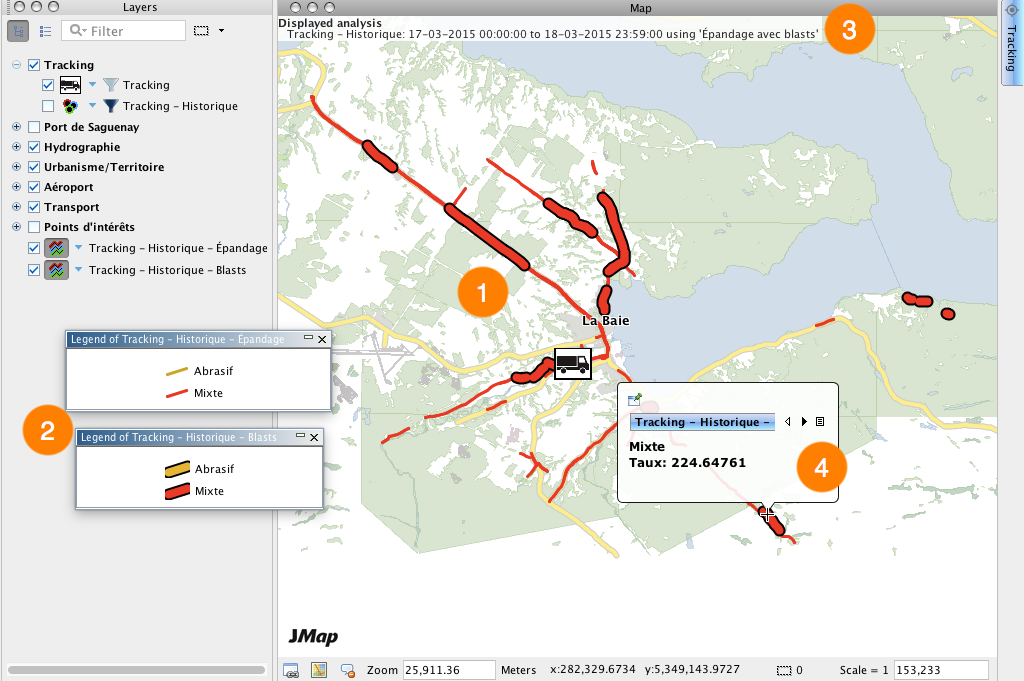
1 |
Route covered by the mobile unit during the spreading of products and blasts, displayed in the map interface. |
2 |
Layers containing the road covered by the mobile unit in the Layer manager. There is one layer for the regular spreading of products and another for blasts. A thematic automatically displays, indicating the type of product used. You can customize the layer's parameters if you have the appropriate permissions, similarly to the application's other layers. |
3 |
A title in the header of the map interface displays the details of the analysis. |
4 |
You can also configure mouseover bubbles displaying data on the mobile unit's spreading activity over time. |
Analyzing the activity of several mobile units
You can select several mobile units for your analyses, and there are different ways to do this. The previous section explained how to add or remove mobile units in the Analysis wizard when an analysis was initiated for a single unit. This section shows some other ways to do this.
From the mobile units list in the Tracking window
1.Click on a mobile unit to select it. By pressing and holding the CTRL key you can select several other mobile units. The Tracking window's function buttons are enabled.
or
2.Select several mobile units by left-clicking and dragging the mouse. The Tracking window's function buttons are enabled.
3.Click on Analysis menu  to display available options. These include Add selected mobiles to the analysis that was previously defined, as well as the Analysis wizard....
If you select Add selected mobiles to the analysis, the mobile units will be added to the last analysis specified. The analysis symbol displays in the States column of each selected unit.
4.Click on Analysis  again to enable the function. The button changes color, indicating that the server is performing the analysis. When the task is finished, the button returns to its original format, and the results are displayed in the map interface.
From the Analysis menu in the Tracking window
The Analysis menu is always active. You can initiate an analysis using this button, without selecting the mobile units.
1.Click on Analysis  . The menu opens, displaying the available options: Analysis wizard... and Reset. You access the Analysis wizard, select the Tracking layers you want among those that are available, and specify the analysis type. Afterwards, you can select the mobile units to which the analysis will apply, as detailed in the previous section.