Map Layers
Table of contents
In JMap, map data is organized in layers. These layers are displayed transparently on the map and are piled one on top of the other. They are independent from one another and can be turned on or off. Layer order is important as some more opaque layers can hide elements found in lower layers. A layer must be visible in order to be displayed on a map and it must be selectable in order for users to select its elements.
The JMap administrator creates project layers as they appear when the project is opened. You can change the order of the layers as well as other settings; these changes will be lost when closing the application unless saved in a context. Refer to Layer Settings and Map Contexts for more information.
The JMap administrator also determines the frequency of automatic updating for each layer, i.e. how often your application will automatically reload the layer data from the JMap server.
Layer Management
The layer management window allows you to turn layers on and off, change the order of layers, modify their settings, and so forth. Two displays are available for layer management: hierarchical display and list display.
The hierarchical display shows the layers logically grouped together in a tree structure. The hierarchy is defined by the JMap administrator. Each group of layers can be turned on or off. Layer order is determined by the system administrator and does not necessarily reflect the order in which layers are displayed on the map. When a group is turned on, all the visible layers it contains are displayed. When a group is turned off, none of the layers it contains and none of the layers in its sub-groups are displayed. Turning a group on or off does not affect the visibility of the layers it contains.
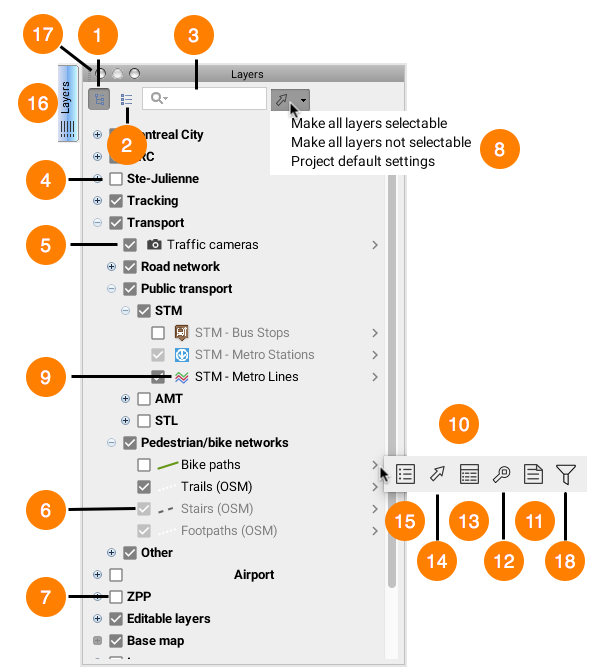
| 1 | Press this button to switch to the hierarchical display. |
| 2 | Press this button to switch to the list display (view details below). |
| 3 | When entering a query in the search field, only the layers whose name contain the contents of your query will be displayed in the layer manager. |
| 4 | The group of layers is invisible. None of the layers that are part of this group will be displayed (even if some of them are checked as being visible). |
| 5 | The layer is visible. Click on it to make it invisible. |
| 6 | The layer is visible, but the map’s current scale does not allow it to be displayed. Placing the mouse pointer over the check box allows you to view the scale at which the layer will be visible. |
| 7 | The layer is invisible. Click on it to make it visible. |
| 8 | This option allows you to perform the following (in a single click):- make all layers selectable,- make all layers not selectable,- return to project default settings. |
| 9 | Graphical representation of layer on map.When the layer is a thematic, clicking on it allows you to obtain its legend. |
| 10 | Pop-up menu, accessible for each layer. |
| 11 | This option allows you to access layer metadata. Refer to the Layer Metadata section. |
| 12 | Zoom to display the full extent of the layer, allowing you to view the entire territory on which the elements of this layer are found. |
| 13 | This option allows you to access the elements explorer. |
| 14 | This option allows you to make the layer selectable or not selectable. |
| 15 | This option allows you to access the layer’s settings. |
| 16 | This option allows you to hide the layer manager, minimizing it into a tab. |
| 17 | This option allows you to close the layer management window. |
| 18 | This option allows you to access the filter. |
The list display presents the map layers in an organized list; all layers are displayed at the same level. The order of the layers in the list reflects the order according to which they are displayed on the map. The layer at the bottom of the list is the first one drawn on the map, and the layer at the top is the last one drawn. This interface allows you to change layer order by dragging a layer up or down in the list.
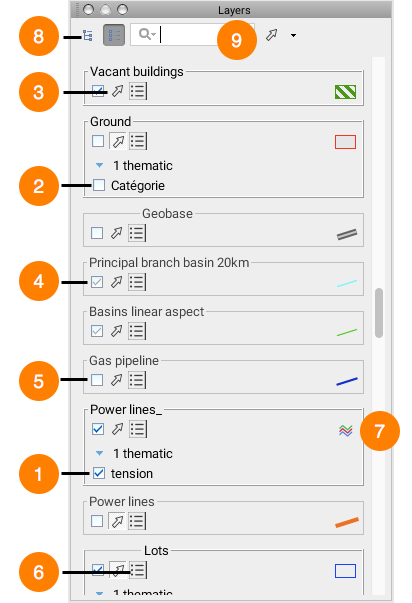
| 1 | The thematic is enabled. |
| 2 | The thematic is disabled. |
| 3 | This option allows you to make the layer selectable or not selectable. |
| 4 | The layer is visible, but the map’s current scale does not allow it to be displayed. Placing the mouse pointer over this check box allows you to view the scale at which the layer will be visible. |
| 5 | The layer is invisible. |
| 6 | This option allows you to access the layer’s settings. |
| 7 | This option allows you to display the thematic’s legend. |
| 8 | A single click on this button brings you back to the hierarchical layer manager. |
| 9 | When entering a query in the search field, only the layers whose names contain the contents of your query will be displayed in the layer manager. |
Elements Explorer
The elements explorer displays the attributes that are bound to the layers’ elements. Each table is associated with a specific layer and each line in the table represents a layer element. This interface offers several possibilities for working with attributes.
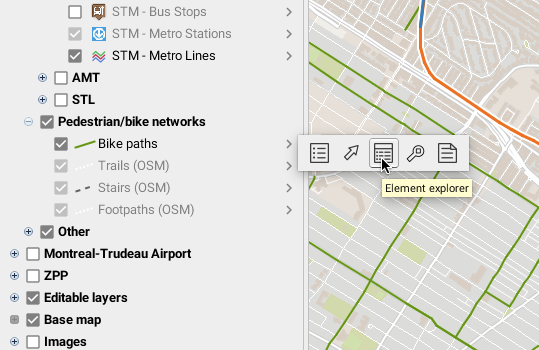
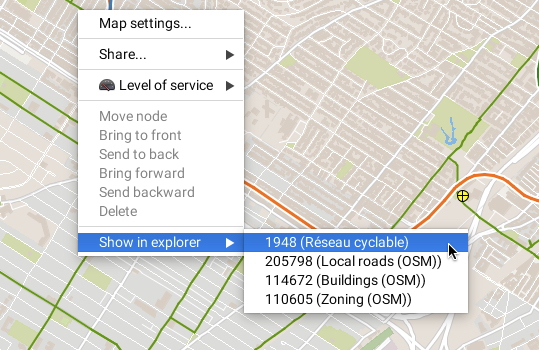
The elements explorer can be enabled from the layer management window. It can also be opened by right-clicking on a map element and selecting Show in explorer. The elements explorer will open and select the row of attributes associated with the element. Conversely, double-clicking on a row in the table will zoom in on the associated element in the map; the element will briefly flicker.
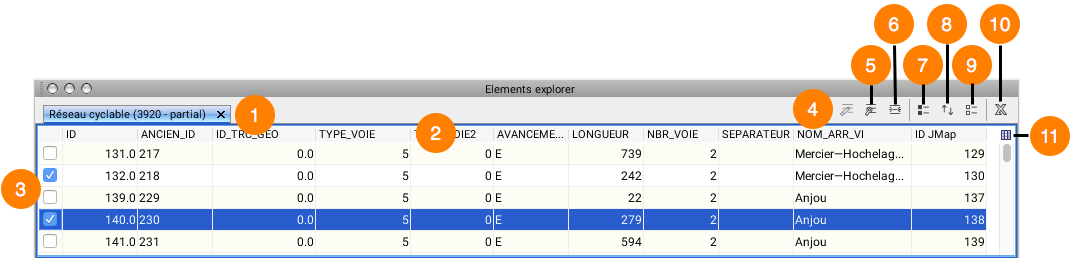
| 1 | Each tab is associated with a layer. The name of the layer is indicated, along with the number of elements that are loaded. The number of elements that are loaded on a layer can be inferior to the total number of elements contained within the layer. In this case, a special note (“partial”) is added to the title of the tab. |
| 2 | Each layer attribute is represented by a column in the table. The column header indicates the attribute title. You can sort the table according to the values of an attribute by clicking on the header of the corresponding column. You can also sort the table according to several attributes by holding down the CTRL key and clicking on several headers. Lastly, you can move a column by selecting its header and dragging it horizontally. |
| 3 | The check boxes of the first column are used to select elements. All elements that are selected in the table will appear selected on the map. Conversely, all elements selected using selection tools on the map will be selected in the table. |
| 4 | Press this button to enable edit mode. Edit mode allows you to modify attribute values and to erase elements. This function is only available with editable layers including personal layers. |
| 5 | Press this button to enable the automatic zoom function. If this function is enabled, the selected rows in the table will cause the map to zoom in on the associated map elements. |
| 6 | Press this button to enable the automatic highlight function. When this function is enabled, the elements corresponding to the selected rows will blink on the map. |
| 7 | Press this button to select all of the layer’s elements. |
| 8 | Press this button to invert the selection on the layer. All selected elements will become unselected and vice-versa. |
| 9 | Press this button to unselect all of the layer’s elements. |
| 10 | This button allows you to open the attributes table in a spreadsheet program such as Excel or export the table to a file in CSV format. |
| 11 | This button allows you to select the attributes to be displayed in the explorer.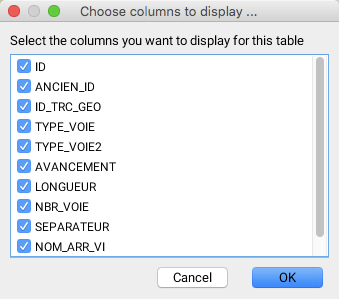 |
Thematic Maps
Thematic maps allow you to illustrate information pertaining to a particular theme. For example, a thematic map on criminality could illustrate the various sectors of a city in different colors based on the crime rate in each of these. A thematic map could also illustrate the results of an election by representing a breakdown of the votes for each party in a pie chart. JMap allows you to create customized thematic maps using the various layers that are available and their attributes. Some thematics may be predefined by the JMap administrator but users can create new ones. Several thematics may exist for the same layer and each of these may be enabled or disabled. Each thematic has its own legend that can be displayed from the layer manager.
There are 2 categories of thematics in JMap: classifications and proportional quantities.
Classification Thematics
Classification thematics separate map elements into a number of classes (also called categories); each class has its own display style, which causes certain visual variables to change (fill color, stroke style, etc.). Therefore, all elements belonging to the same class share the same display properties.
The various types of classification thematics are presented below.
Graduated Styles
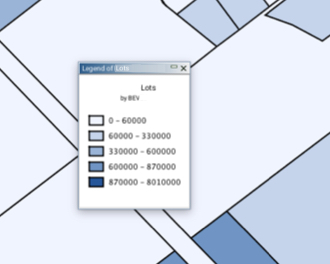
Graduated styles thematics use a graduation of one or more visual variables to represent the elements of various categories.
Examples of graduating visual variables include: graduation of the fill color of polygons from white to red; graduation of the size of an individual symbol from 1 to 5; graduation of the width of lines from 1 to 4, and so forth. In all cases, there is a finite number of categories and every element of the layer falls into one of these categories. Only numeric attributes can be used for this type of thematic.
Several methods can be employed to calculate the value ranges for the categories of this type of thematic. Refer to Method for Calculating Value Ranges for Categories for more information.
Graduated Symbols
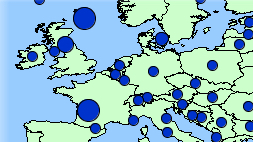
Graduated symbols thematics draw circular symbols on the map elements they qualify. The symbol sizes graduate according to a finite number of categories based on a numeric attribute.
Several methods can be employed to calculate the value ranges for the categories of this type of thematic. Refer to Method for Calculating Value Ranges for Categories for more information.
Individual Values
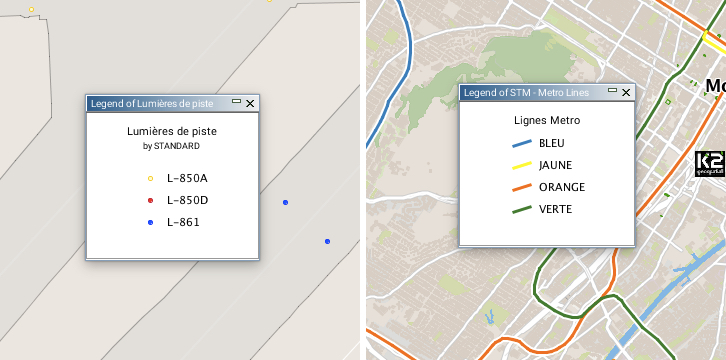
Individual values thematics display all elements of a given attribute possessing the same value with the same graphical properties. This type of thematic does not use ranges of values but rather specific values. There are as many classes as there are different values. The maximum number of different values allowed is 512. If a layer has more unique values, it will not be possible to create this type of thematic on that layer. Numeric and alphanumeric attributes can be used for this type of thematic.
Individual Custom Values
Individual custom values thematics are similar to individual values thematics but they allow you to add values to the ones existing in the data. This is useful when you create a thematic using a data set that does not contain all the known possible values for an attribute at the time when the thematic is created.
Proportional Quantities Thematics
Proportional quantities thematics display map elements by using a continuous variation of a visual variable based on a set of numeric attributes. No class is used, but an infinite number of displays are possible.
Proportional symbols
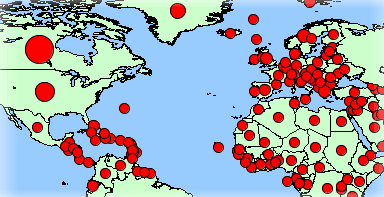
Proportional symbols thematics draw circular symbols on the center of the elements they qualify. The symbol sizes are determined by interpolation between the minimum and maximum values of a given numeric attribute.
Pie Charts
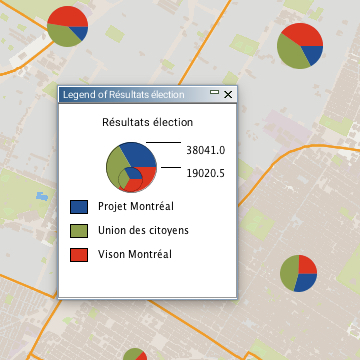
Pie chart thematics draw pie chart diagrams on the center of the elements they qualify. This type of thematic is based on one or many numeric attributes. Each part of the diagram (piece of the pie) is associated with a given numeric attribute. The size of the diagram is proportional to the sum of the values of the element attributes; it is determined by interpolation between the minimum and maximum values of the sums of the attribute values.
Bar Charts
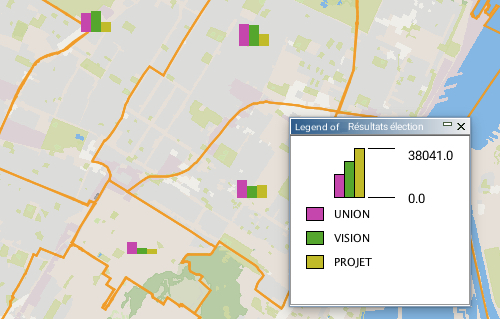
Bar chart thematics display bar chart diagrams (also called histograms), which are superposed on the center of the elements they qualify. This type of thematic is based on one or more numeric attributes. Each part of the diagram (bar) is associated with a given numeric attribute. The size of the diagram is proportional to the sum of the elements’ attribute values. It is determined by interpolation between the minimum and maximum values of the sums of the attribute values.
Method for Calculating Value Ranges for Categories
Several different methods can be employed to calculate the value ranges for the categories of graduated styles or graduated symbols thematics:
-
Equal ranges: The ranges will be equal in size (e.g. 0-10,10-20, 20-30).
-
Equal count: The range limits will be calculated so that an equal count of elements falls in each class.
-
Standard deviation:The range limits will be calculated so that the average value falls in the middle of the range, and the range size for each category is equal to the value of the calculated standard deviation.
-
Defined intervals: The range size is user-defined and constant for all categories.
-
Percent ranges: The size of each range is expressed as a percentage of the full range of values (e.g. 4 categories with 20%, 20%, 35% and 25%). The total must be equal to 100%.
-
Custom ranges: All range limits are user-defined.
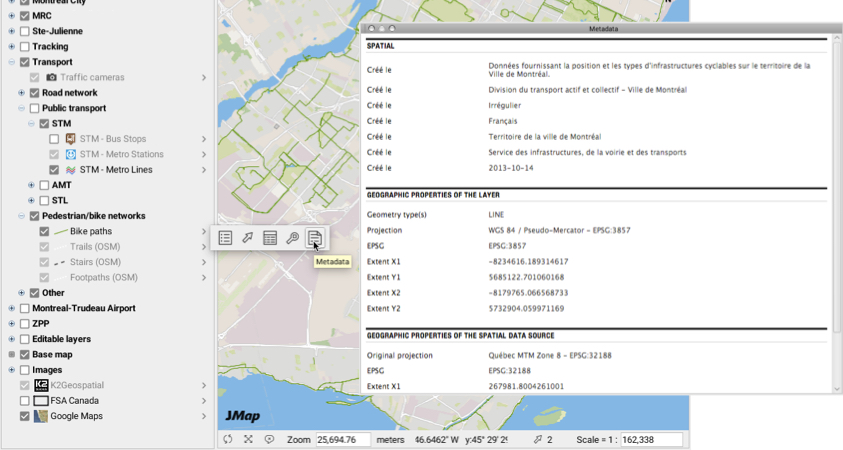
Layer Metadata
Information on the various layers of a project can be available in JMap Pro. This information could include the source of data, the date the last update was performed, the quality of the data, etc. This information, called layer metadata, is configured by the JMap administrator.
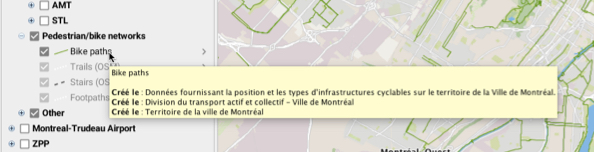
If a layer has metadata, you can preview it by placing the mouse pointer on the name of the layer in the layer manager.
To access the complete version of the metadata, you must click on the metadata button in the layer settings menu.