Tools
Table of contents
Several tools allow you to work with map layer data.
Labeling
In JMap, labels are text values attached to map elements. They are used to display the attribute values of a layer’s elements. For instance, labels can display street names on a linear road system or names of cities represented on the map by points.
Labels can either be placed manually or generated automatically by JMap when the data is displayed. The labeling tool is only used for manually created labels.
 Add labels
Allows you to manually create a label by clicking on a map element. The label is displayed according to the settings that have been configured for the element’s layer.
 Remove labels
Press this button to delete all labels that have been added manually.
Note: Labels can be deleted individually by doing the following: enable the labeling tool, press and hold the ALT key and click on the label you wish to delete.
Selection
You can select elements on vector layers only. The selected elements can be used to perform various actions, such as running an information report, spatial analysis, editing, etc. Several selection tools are available. Note that to select layer elements, the layer must be selectable (refer to the section on layer settings).
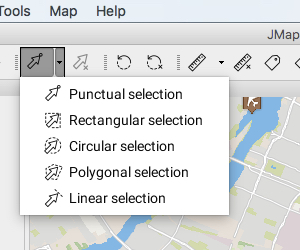
The following figure shows the list of available selection tools.
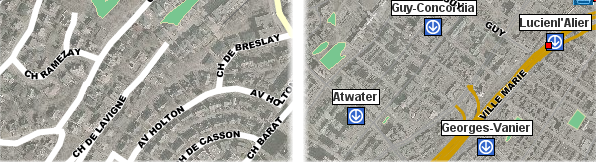
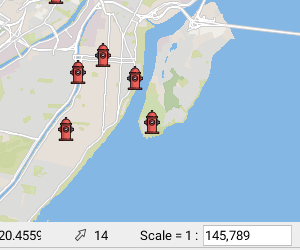
The number of selected elements is always indicated at the bottom of the map.
![]() Punctual selection
Punctual selection
Select a single element by clicking on it. When several elements are superimposed, only the top one is selected. Enable the tool and click on an element in the map.
 Rectangular selection
Select one or more elements by tracing a rectangle. All elements that are completely or partially included in the rectangle are selected. The rectangle’s dimensions are displayed. Enable the tool and trace a rectangle on the map.
 Circular selection
Select one or more elements by tracing a circle. All elements that are entirely or partially included in the circle are selected. The circle’s radius is displayed. Enable the tool and trace a circle on the map.
 Polygonal selection
Select one or more elements by tracing a polygon. All elements that are entirely or partially included in the polygon are selected. The dimensions of the polygon are displayed. Enable the tool and trace a polygon on the map. Double-click or press the spacebar to complete the polygon.
 Linear selection
Select one or more elements by tracing a line. All elements on the line’s path will be selected. Enable the tool and trace a line on the map; double-click or press the spacebar to complete the line.
Note: this option does not work with map points.
 Clear selection
Unselect all selected elements on the map.
Note: Using any selection tool, you can press and hold the CTRL key to add or remove elements in an existing selection.
Selection tools are compatible with the snap function (refer to the Snap section).
Selection Explorer
The selection explorer displays the attributes that are bound to the selected elements in the layers. Each layer is represented by a tab; the interface allows you to access all selected elements at any time, regardless of the layer they belong to. The selection explorer functions in a similar way to the elements explorer except that it only presents the map’s selected elements (refer to the Elements Explorer section).
The figure shows the selection explorer interface:
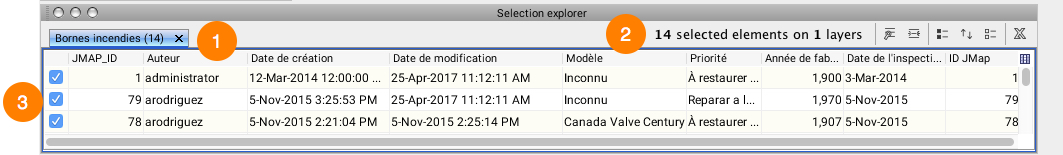
| 1 | Each layer that contains selected elements is represented by a tab, which indicates the name of the layer and the number of selected objects. |
| 2 | A message indicates the total number of selected objects and the number of layers the selection spans. |
| 3 | All elements that are listed are selected. If you unselect an element, it disappears from the table. |
Information
JMap includes several tools that provide information on map elements.
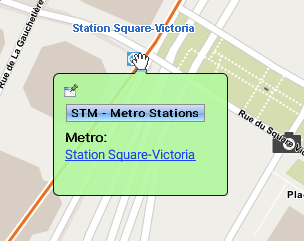
Information report
This tool opens an information report related to the map elements. Reports display descriptive data pertaining to the pointed elements. They are defined by the JMap administrator. Enable the tool and click on one of the map’s elements. If several elements of one or more layers are pointed, several reports will be available in the same window, but only one can be viewed at a time.
The figure illustrates information reports on 2 layers:
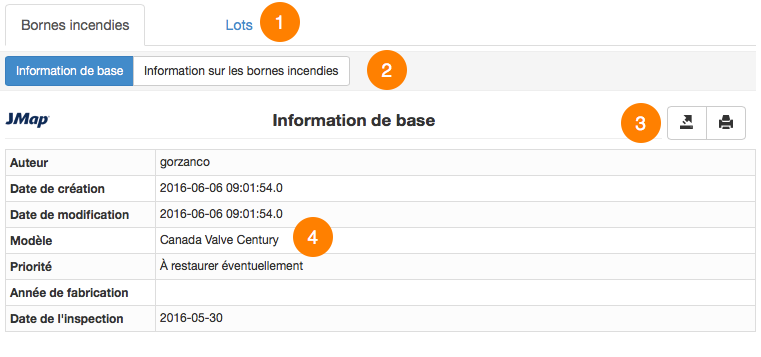
| 1 | The top portion of the report displays the names of the layers for which information reports are available at the pointed area. |
| 2 | Clicking on a given layer allows you to view its list of available reports; the first report is automatically displayed. |
| 3 | The contents of the displayed report can be exported towards an Excel file or printed. There are also more advanced reports that allow you to export individual attributes to a CSV file. |
| 4 | Information contained in the report is configured by the JMap administrator. It can originate from the layer itself or from other data sources associated with the map layer. |
Selection information report
This tool allows you to open an information report containing information on all of the selected elements. Select elements and open the report by clicking on the information reports icon.
The figure shows an exemple of information report on selection:
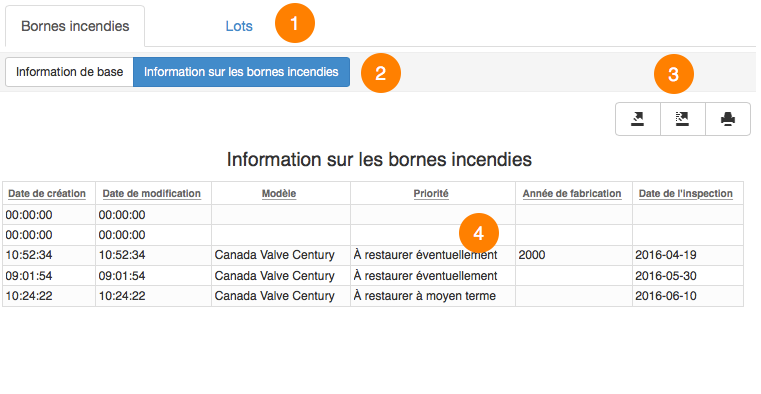
| 1 | The names of the layers on which selections have been performed are displayed at the top of the report. |
| 2 | Clicking on a given layer allows you to view its list of available reports; the first report is automatically displayed. |
| 3 | The contents of the report displayed can be exported in individual columns to a CSV file, exported in whole to an Excel file, or printed. |
| 4 | Information contained in the report is configured by the JMap administrator. It can originate from the layer itself or from other data sources associated with the map layer. |
Geometry information
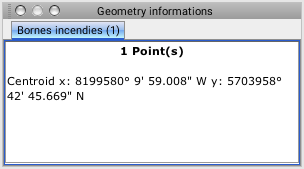
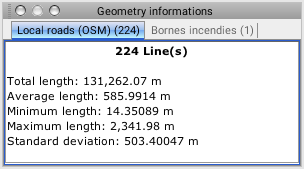
This tool allows you to obtain information on the geometry of the map’s elements. The information varies according to the type of geometry (point, line, polygon, etc.) and the number of selected elements. Select one or more elements on the map and click on the button for this tool.
The figure shows the geometry information on a single map element:
The figure shows the geometry information on multiple map elements:
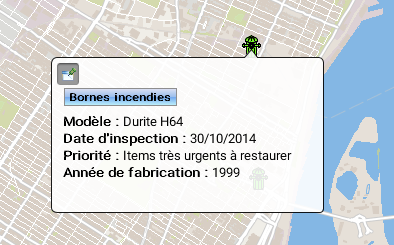
Mouseover
Mouseover bubbles contain information on map elements. They are automatically displayed when the mouse pointer remains on the elements of certain layers. Mouseover bubbles can contain attribute values, links to web pages, images, etc. When several elements are superimposed, mouseover bubbles display the information for all the elements, grouped by layer.
Mouseover bubbles can be used to display HTML content, images or 360 degree photos. When the mouseover contains many photos or large photos (such as 360 degree photos) it may have a delay in its display.
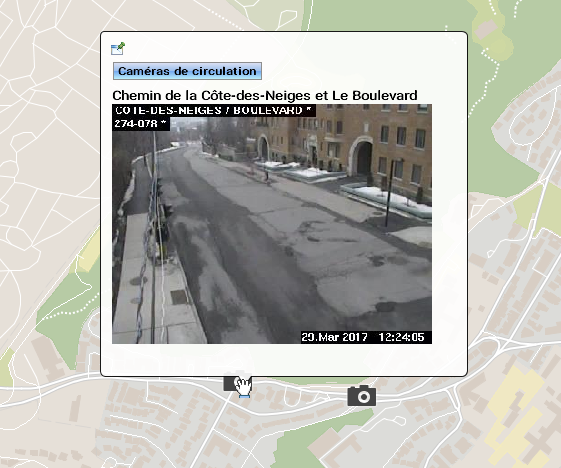
You can display the title of a photo and its comments by double-clicking on it to open the photo viewer.
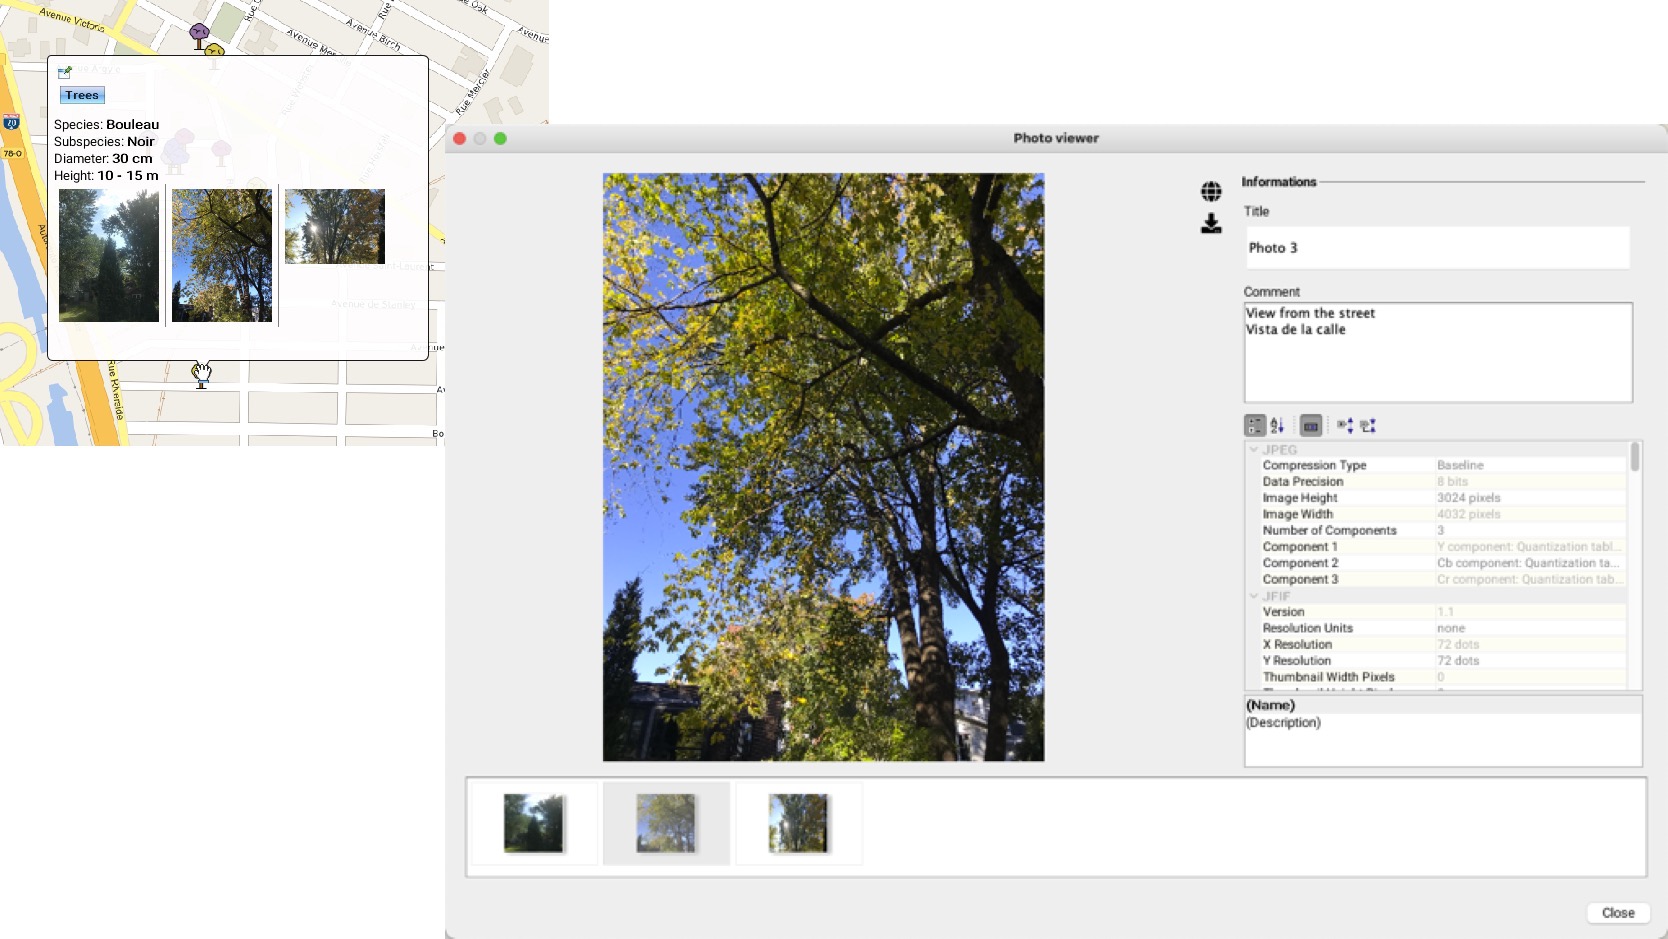
The  icon allows you to display the photo in 2 or 3 dimensions. The
  icon allows you to download the photo.
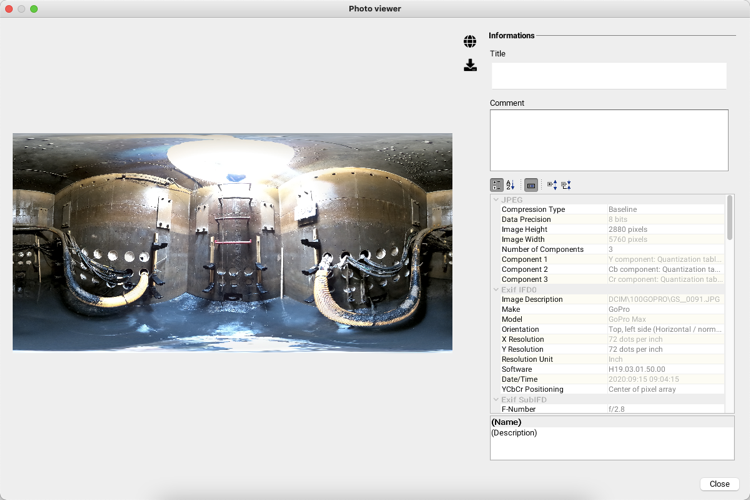
In the case of 360 degree photos, information about the photo can be displayed and you can navigate the photo.
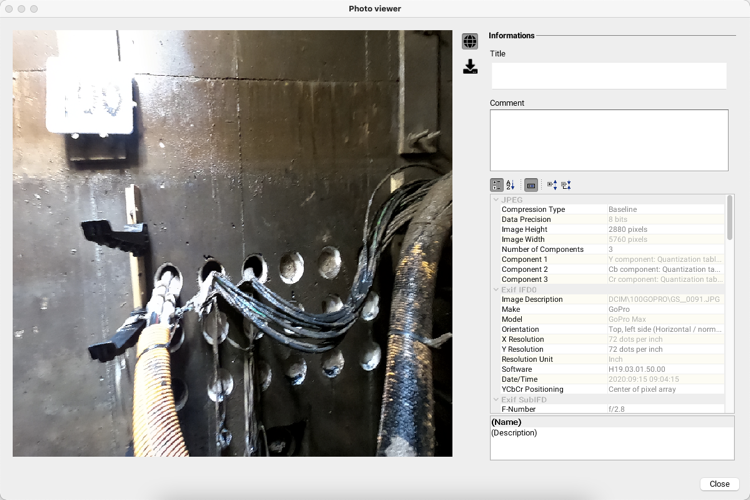
To view the photo in two dimensions, . To return to the 360 degree view, click on the same icon.
The colour of mouseover bubbles can be configured (refer to Layer Settings. It can be different for each information layer.
Mouseover bubbles can be pinned to the screen in order to be displayed persistently. To pin a mouseover bubble, click on the icon located in its upper left corner.
You can select and copy the contents of a mouseover bubble by clicking on the icon located in its upper left corner and pasting it in another document (Word, Excel, etc.) using the Ctrl-C and Ctrl-V keyboard shortcuts.
You can also adjust the delay before the mouseover bubbles appear, according to your preferences (refer to the Application Settings section).
You can also disable all mouseover bubbles on the map by clicking on the  button located in the lower left part of the map.
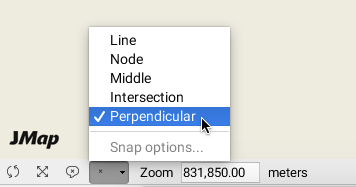
Snap
Most of the tools for drawing map objects (measurement tools, selection tools, editing tools, etc.) can be used with the snap function, which snaps the pointer to existing elements. This is useful to measure the exact distance between two elements, for example.
The menu found on the status bar of the map displays the parts of elements on which you can snap the pointer. Press the arrow to open the menu and select by checking the snap options. Click on  to enable the snap feature. The icon goes dark. Press the icon again to disable the function. Your snap options remain selected.
Line
You can snap the pointer to the closest line on the map.
Node
You can snap the pointer to the closest node on the map.
Middle
This option allows you to snap the pointer in the middle of a line or of a polygon’s segment.
Intersection
This option allows you to snap the pointer at the intersection of two lines.
Perpendicular
This option allows you to snap the pointer to a line or polygon segment perpendicularly.
Measurement
Measurement tools allow you to calculate distances and surfaces (area and perimeter). Measurements remain on the map until they are erased, allowing you to make several measurements, to print these with the map and save them in map contexts.
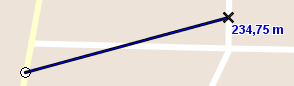
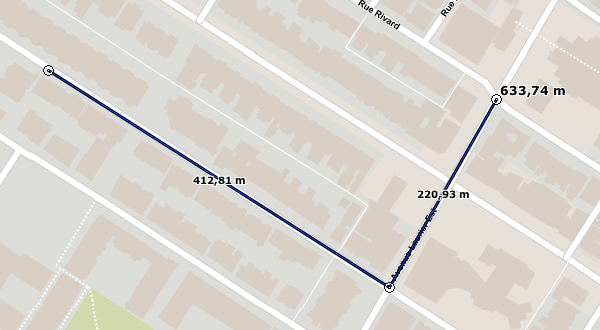
Distance measurement
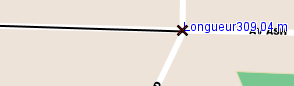
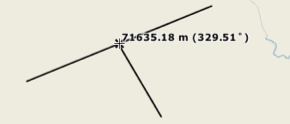
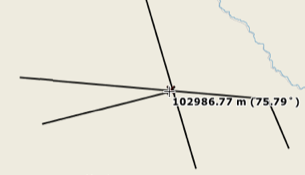
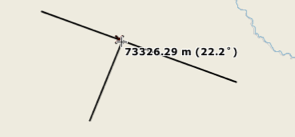
The distance measurement tool allows you to calculate the distance between two points at a bird’s eye view. The tool allows you to measure multiple segments; you then obtain the distance of each individual segment as well as the total distance of all segments. The measured distances are persistent, meaning they remain on the map until the user erases them.
-
Enable the tool.
-
Click on the desired area of the map once to get started.
-
Click on the desired area of the map to complete each segment.
-
Double-click on the map or press the spacebar to complete the measurement and display the total distance.
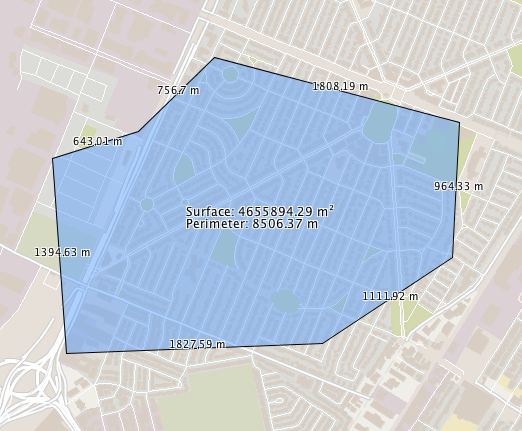
Surface measurement
The surface measurement tool allows you to measure areas and perimeters by tracing a polygon on the map. The measurements are persistent, meaning they remain on the map until the user erases them.
-
Enable the tool.
-
Click on the desired area of the map once to get started.
-
Click on the desired area of the map to complete a segment; repeat if desired.
-
Double-click on the map or press the spacebar to close up the polygon, complete the measurement and display the results.
Erase measures
Measurements remain on the map until they are erased. Press  to erase all of them.
Note: Measurements can be erased one at a time by following these steps:
-
Enable measurement tool (distance or surface).
-
Press and hold the ALT key.
-
Click on the measurement you wish to erase.
Measurement tools are compatible with the snap function (refer to Snap).
Note: To obtain the geometric properties of a map element (length, area, centroid, etc.), you can use the geometry information tool (refer to the Information section) instead of the measurement tool.