The Data
Table of contents
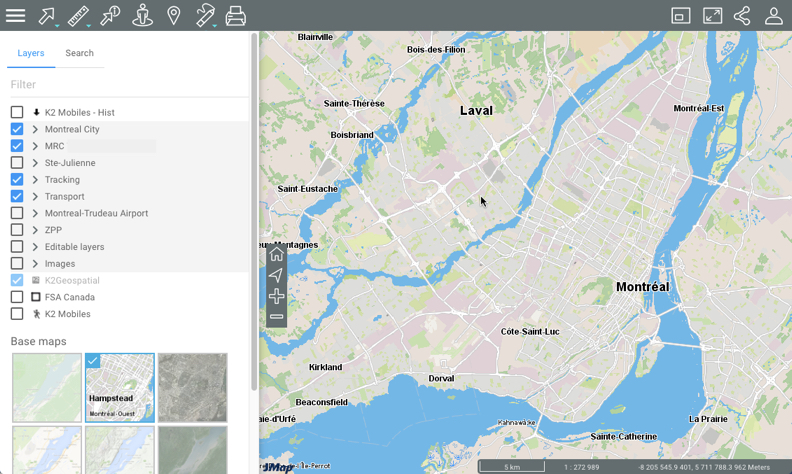
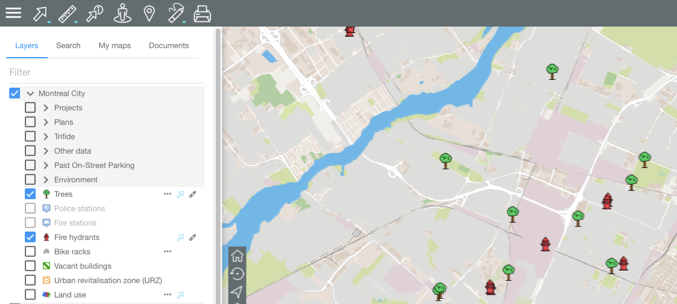
The data contained in the application is organized into themes and can be accessed through the map interface. The data of a single theme forms a layer to which descriptive data is associated. Layers are superimposed on one another to form the map displayed in the map interface.
There are two types of layers in JMap Web: base maps, which form the map background, and layers, which contain useful information. Layers can be displayed or hidden, as needed.
Display layers
-
Click on
 Sidebar to open the sidebar and display its two tabs, Layers and Search.
The Layers tab contains the list of layers, organized into two groups: Layers and Base maps.
The Filter field allows you to filter layers and base maps based on their name or a part of their name.
-
Click on
Sidebar to close the sidebar and display only the map.
Layers
Layers contain spatial information pertaining to various subjects.
Groups of layers
Layers can be organized hierarchically into groups in order to simplify work. Groups of layers are indicated in grey, and an arrow  is displayed next to the name of each group. To view the layers composing a group:
-
Click on the arrow
next to the name of a group. Click on the arrows to open the various subgroups of the hierarchy.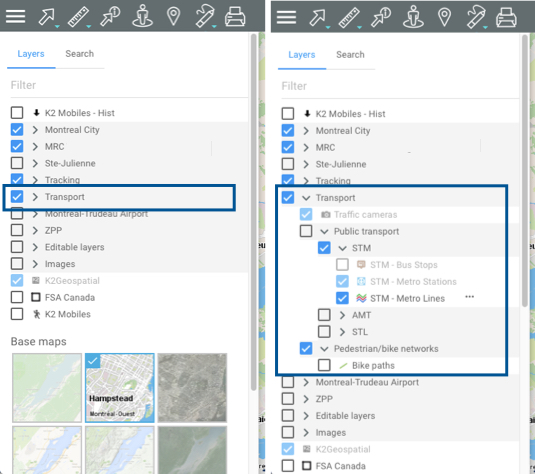
-
Click on the arrow
 next to the name of a group to close it.
Viewing a layer
-
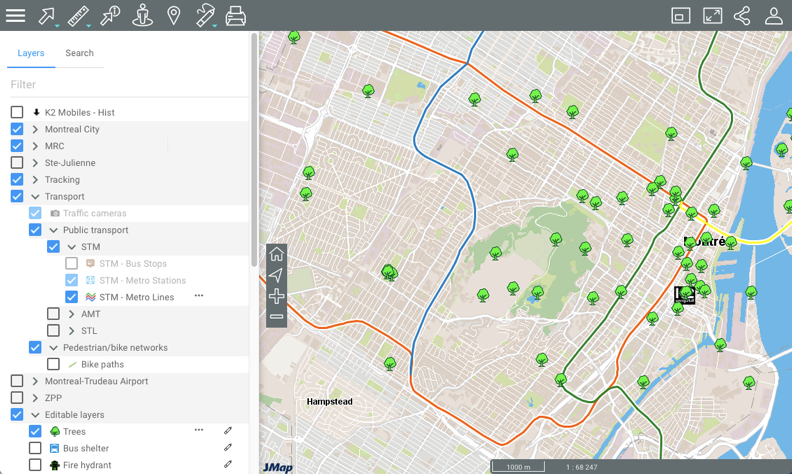
Check the box located left of the name of the group and/or layer to display it in the map interface. When a group is selected, all the visible layers (whose check boxes are selected) will be displayed. When a group is unselected, none of the layers it contains or that are contained in subgroups will be displayed. Selecting or unselecting a group does not affect the visible/invisible state of the layers it contains. You can display several layers at the same time; the only restriction is the readability of the map.
-
Unselect the check box to stop displaying the layer and/or group of layers.
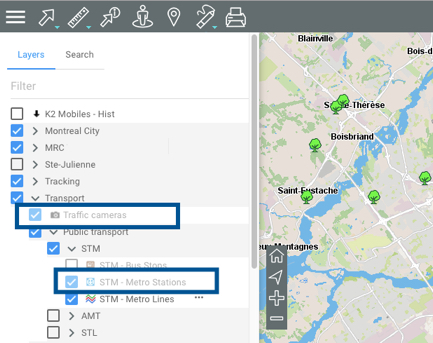
Range of map scales
Each layer is visible within a certain range of map scales. When the names and icons of layers are shown in lighter tones, this means the current map scale is outside of the visibility scale range of these layers. You can zoom in or out to find their visibility scale range.
In the row of each layer, there are icons to access different functions. Some of the icons are displayed permanently, and others appear when the pointer is moved over them.
Making layers selectable
The arrow next to the name of a layer represents the function that makes layer elements selectable. This function is enabled by default for certain application layers; when the function is enabled, the arrow is blue . If the function is not enabled:
-
Click on the arrow
 . The arrow becomes blue
 , indicating that the layer’s elements can be selected using the interactive selection tools. For more information on this topic, refer to Selecting Elements in the Map Interface .
You can select the elements of multiple layers at once.
You can make each layer of a group independently selectable.
-
Click on the arrow
.
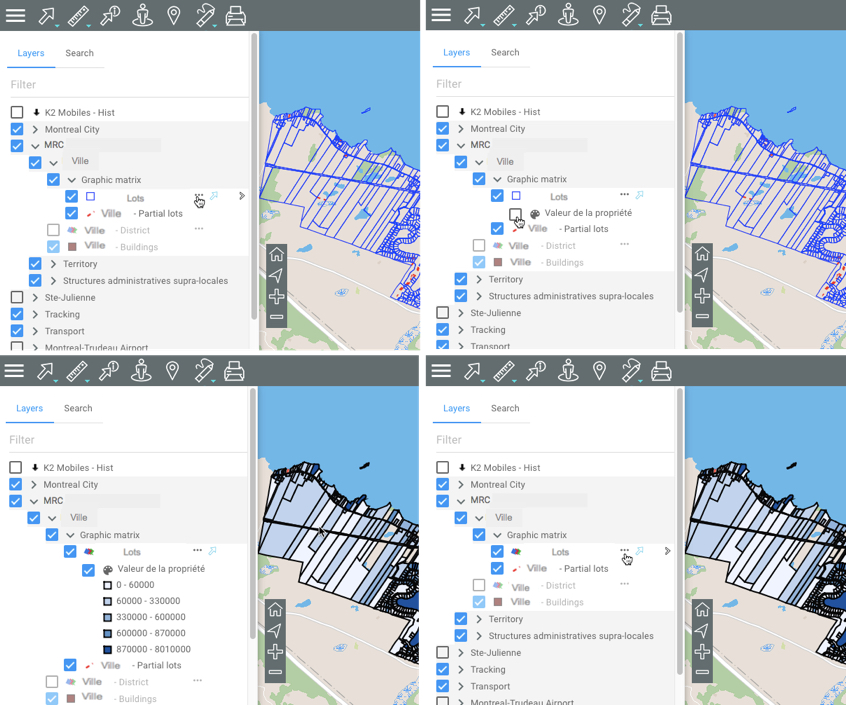
Displaying thematics
The  icon indicates that the layer has one or more thematics. When thematics are present, the appearance of the layer’s elements will vary based on one or more attributes.
-
Click on the
icon to display the thematics. -
Check the thematic you wish to display. The legend of the thematic is displayed, and the layer adopts the appearance of that thematic. The legend can be dynamic, constantly refreshing to display only visible classes on the displayed map.
-
Unselect the thematic to disable it.
-
Click on the
icon to hide the thematic.
The  arrow offers access to other functions, such as bringing the map to the layer’s geographic extent, opening the configuration interface of a filter, and displaying any existing metadata for the layer.
Bringing the map to the layer’s geographic extent
-
Click on the arrow
. A magnifying glass  icon appears.
 -
Click on the icon
. The geographic extent of the data layer is displayed and centered in the map.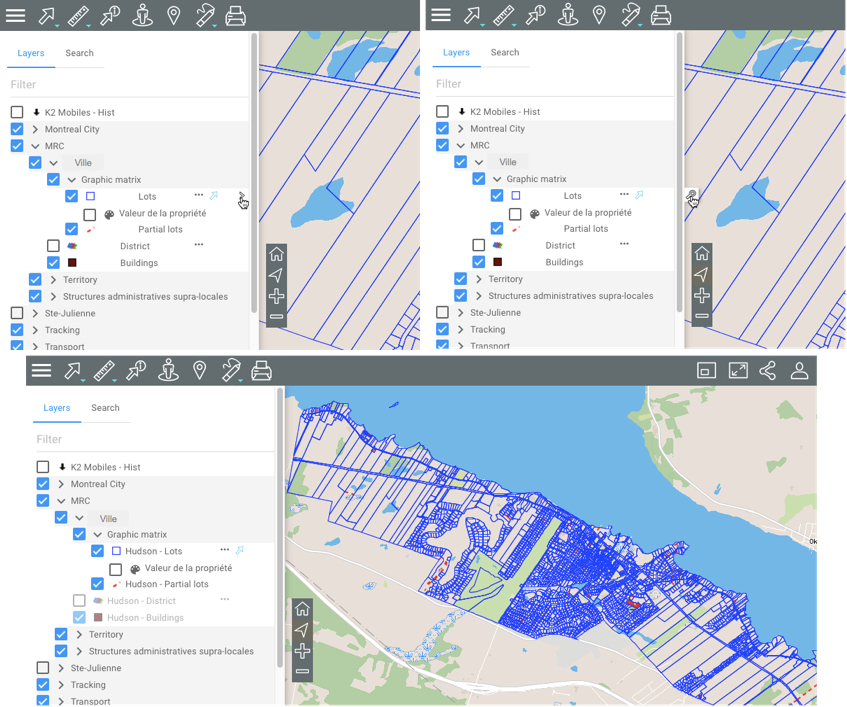
Displaying metadata
-
Click on the arrow
. If the icon appears, it indicates that the layer has metadata.
 -
Click on the
icon to display the metadata interface.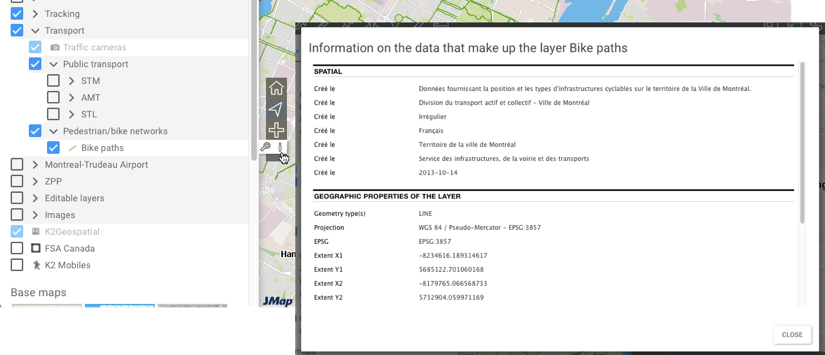
Setting up a filter
Some vector layers provide the ability to configure a filter to display only certain elements. To configure a filter:
-
Click on the arrow
to display the icon  .
. -
Click on the
to open the filter configuration interface. -
Click on
 to add an attribute. Each attribute has an operator and an attribute value. Operators vary depending on the attribute type.
 -
Click on OK. Items that do not pass the filter are not displayed in the layer. The icon
next to the layer name indicates that a filter is enabled.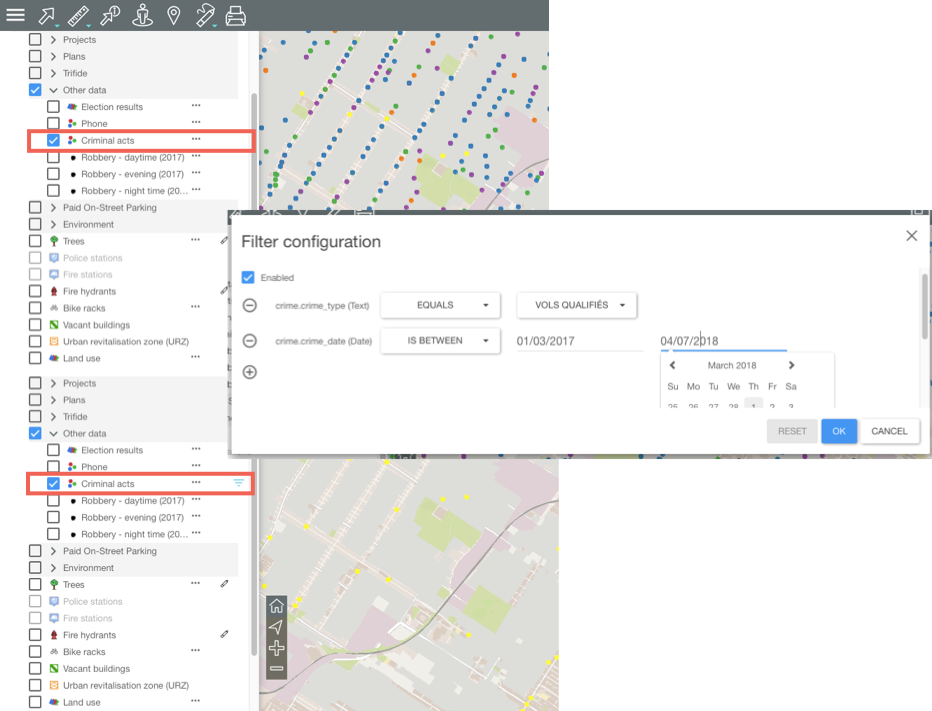
Filter operators
equals: This operator filters a layer’s elements to display the elements whose attribute value (regardless of its type) is equal to one of the values selected by the JMap administrator or JMap Web user.
does not equal: This operator filters a layer’s elements to display the elements whose attribute value (regardless of its type) is different from the values selected by the the JMap administrator or JMap Web user.
greater than: This operator filters a layer’s elements to display the elements whose attribute value (numeric or date) is greater than the value selected by the JMap administrator or JMap Web user.
greater or equal to: This operator filters a layer’s elements to display the elements whose attribute value (numeric or date) is greater than or equal to the value selected by the JMap administrator or JMap Web user.
less than: This operator filters a layer’s elements to display the elements whose attribute value (numeric or date) is less than the value selected by the JMap administrator or JMap Web user.
less or equal to: This operator filters a layer’s elements to display the elements whose attribute value (numeric or date) is less than or equal to the value selected by the JMap administrator or JMap Web user.
contains: This operator filters a layer’s elements to display the elements whose attribute value (text) contains the value selected by the JMap administrator or JMap Web user.
is empty: This operator filters a layer’s elements to display the elements whose attribute (text) does not have a value.
is not empty: This operator filters a layer’s elements to display the elements whose attribute (text) has a value.
is null: This operator filters a layer’s elements to display the elements whose attribute value (regardless of its type) is null.
is not null: This operator filters a layer’s elements to display the elements whose attribute value (regardless of its type) is not null.
is between: This operator filters a layer’s elements to display the elements whose attribute value (numeric or date) is within the range defined by the two values entered by the JMap administrator or JMap Web user.
is not between: This operator filters a layer’s elements to display the elements whose attribute value (numeric or date) is not within the range defined by the two values entered by the JMap administrator or JMap Web user.
last: This operator filters a layer’s elements to display the elements whose date attribute value is within the range (expressed in years, months, week(s), day(s), hour(s)) defined by the JMap administrator or JMap Web user.
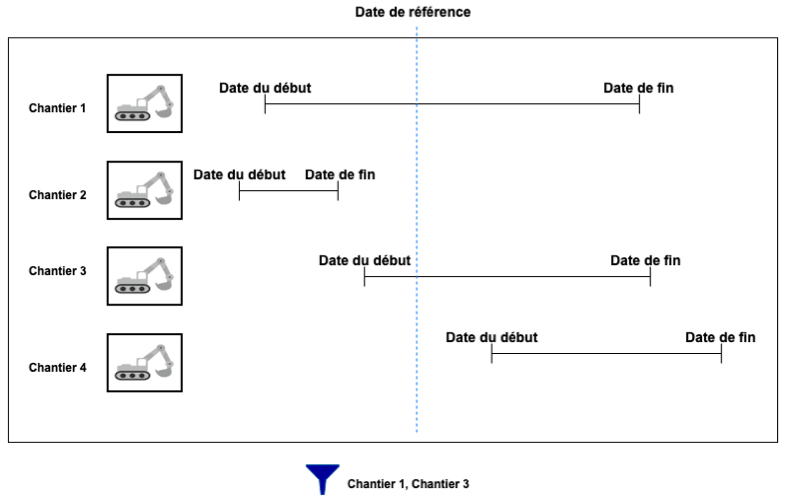
interval: This operator filters a layer’s data based on time ranges defined using a start date, an end date and a reference date. The user therefore has a tool to display data that varies over time.
The layer must contain at least two date and/or timestamp attributes, one of these being the start Date/Time, and the other being the end Date/Time. The values of these dates can be NULL to indicate a start date that goes a long way back or an end date that is very far in the future.
A reference date is also needed. This date can be a specific date (in the past or in the future) or a current Date/Time, which indicates the present moment.
Only layer elements whose reference date is between the start and end date are displayed in the map.
The following figure illustrates this filter.
Making a layer editable
The pencil  icon indicates that the layer is editable. To enable layer editing:
- Click on the pencil. The pencil becomes blue
 , indicating that editing functions are enabled. The Editing Data section offers details on this topic.
 - Click on the pencil to disable layer editing. The icon changes back to grey .
Base maps
Base maps form the background of the map interface and provide a context to situate the information contained in the layers. You can display one base map at a time.
Base maps can be configured specifically for the application or they can originate from web map servers. When you position the mouse pointer on the icon of a base map, its name is displayed.
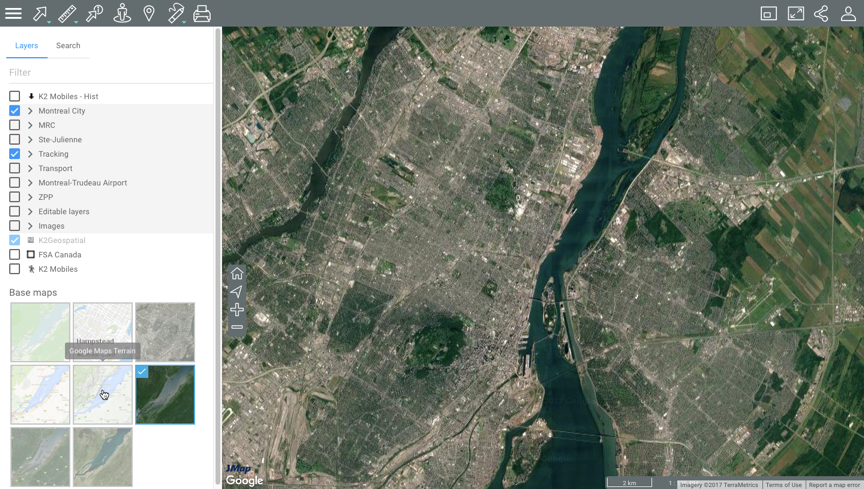
- Click on the map of your choice to display it.
Depending on your application configuration, you can display maps taken directly from web map servers such as Google Maps, Bing, Mapbox and OpenStreetMap.