Accessing Information on a Map Element
Table of contents
You can access various types of descriptive information on an element you select directly in the map interface.
Mouseover bubbles and information reports can contain identical or different descriptive data because they serve different purposes. Mouseover bubbles display quickly, are temporary, and their content is not maintained, whilst the content of information reports can be exported in various ways.
Mouseover
Mouseover bubbles provide a simple way to view information on a specific map element that you click on or touch in the map interface.
This information may include hyperlinks to open and download documents, videos, websites, photos, etc.
To display a mouseover bubble:
-
Click on the element you are interested in to enable its mouseover. The mouseover bubble displays.
-
Click on
 to close the mouseover bubble.
When you click on another element, the mouseover bubble of the first element automatically disappears.
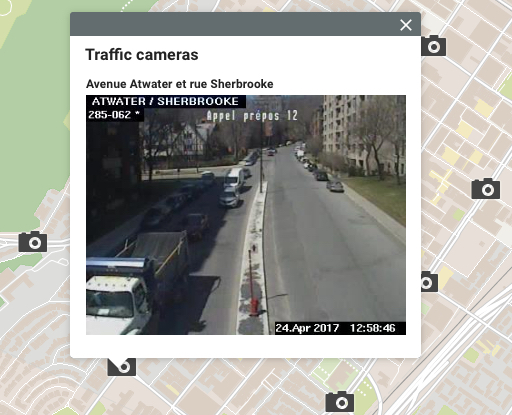
You can access the hyperlinks by clicking them. The documents will be downloaded to your computer and the web pages will open in the default navigator. Photos will open, with their titles and comments displayed. If there is more than one photo, you can browse through the photos in the window using the lateral arrows.
Information report
This tool allows you to view reports that provide information on the selected element. One or more reports can be available for a single element. Some reports may not provide any information on the element.
-
Click on
 to enable the tool. The icon turns blue
 .
-
Click on a map element to generate its associated information reports. If no information report is associated with an element, no report is displayed.
-
Click on Close in the report window to return to the map interface.
-
Click on
.
There are various types of information reports. The simplest reports contain functionality to export the report in Excel format and to print the report. Advanced reports also contain functionality to export certain attributes to a CSV file.
The interface of a basic report is as follows:
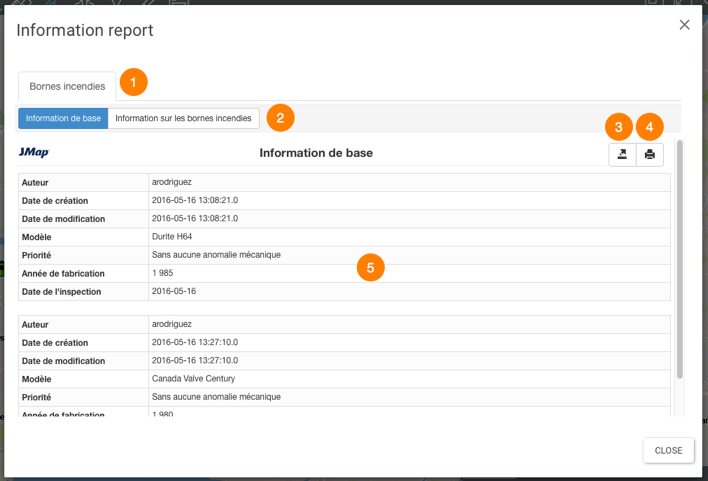
| 1 | The name of the map layer that contains the elements selected in the search. |
| 2 | The name of the report. |
| 3 | This tool allows you to export the report to an Excel file. |
| 4 | This tool allows you to print the report. |
| 5 | The element’s descriptive data. |
The interface of an advanced information report is follows:
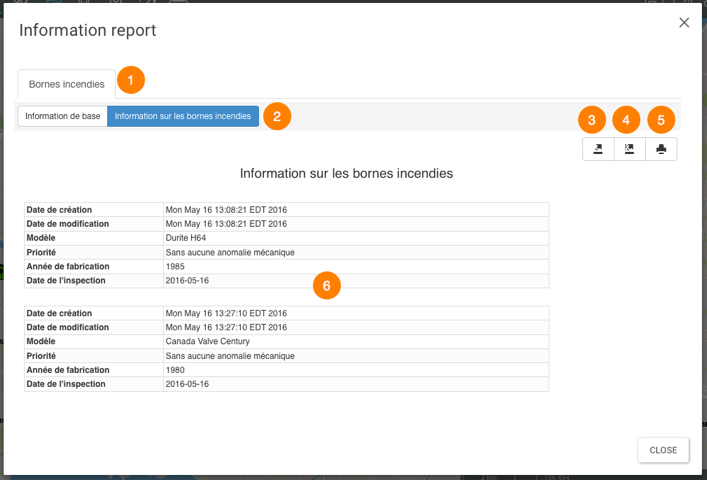
| 1 | The name of the map layer that contains the selected element. |
| 2 | The name of the report. |
| 3 | This tool allows you to export one or more of the element’s attributes to a CSV file. The details are presented below. |
| 4 | This tool allows you to export all of the report’s data to a file. The details are presented below. |
| 5 | This tool allows you to print the report. The details are presented below. |
| 6 | The element’s descriptive data. |
Exporting report data, in whole or in part, to a file
The data contained in the report can be exported to a CSV file to be processed with other software.
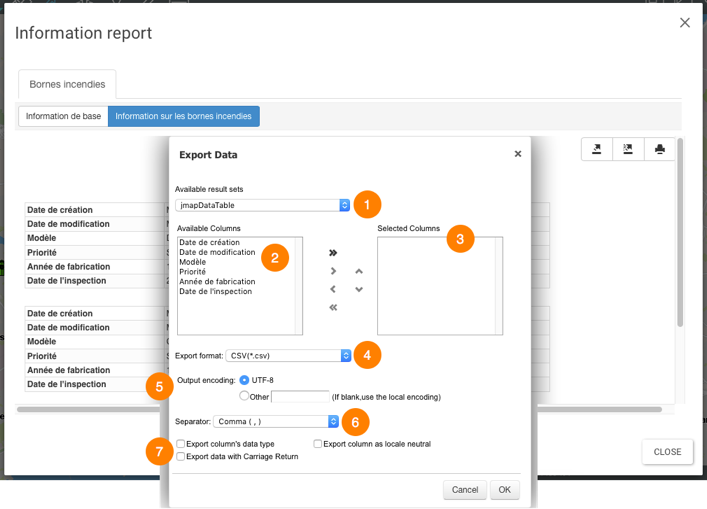
| 1 | Name of the database containing the data. |
| 2 | Attributes that contain the descriptive data of the element and that are available to be exported. Using the  and and  arrows, you can select the attributes you wish to export. arrows, you can select the attributes you wish to export. |
| 3 | Attributes exported to the file.Using the  and and  arrows, you can remove attributes from the selection.Using the arrows, you can remove attributes from the selection.Using the  and and  arrows, you can modify the order of the attributes in the file. arrows, you can modify the order of the attributes in the file. |
| 4 | CSV is the file format. |
| 5 | You can select an encoding type for the data. |
| 6 | You must specify a separator for the data columns. |
| 7 | You can specify a column format. This information is important in order to read the data with databases or other software (when the CSV file is opened with Excel, for instance). |
Exporting the report to a file
The report can be exported to a file.
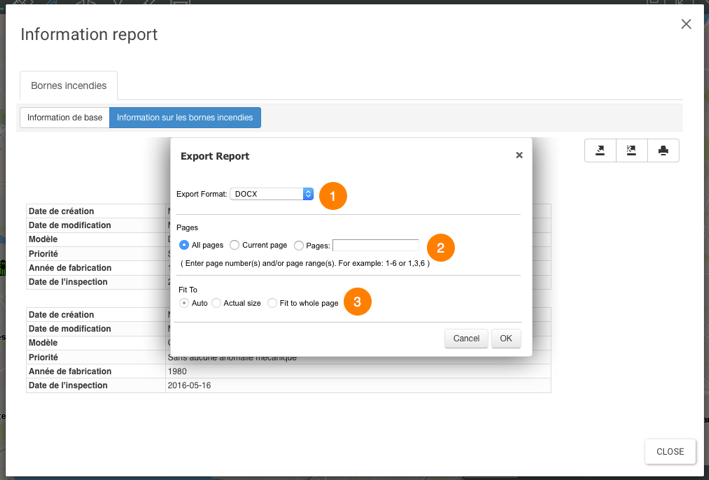
| 1 | The report will be exported to this file format.The following formats are available: DOCX, Excel (XLS), OpenDocument Presentation (ODP), OpenDocument Spreadsheet (ODS), OpenDocument Text (ODT), PDF, PostScript (PS), PowerPoint (PPT), PPTX, Spudsoft Excel, Word (DOC), XLSX. |
| 2 | You can select the report pages you wish to export. |
| 3 | You can indicate how the report will fit in the file. |
Printing the report
The report can be saved for printing and sharing purposes.
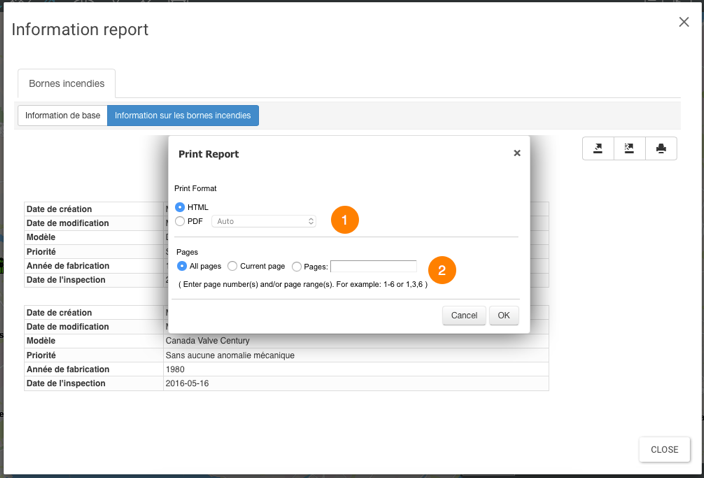
| 1 | The format in which the report is saved. The following formats are available: HTML and PDF. PDF offers three options: Auto: Adjusts the document automatically. Actual size: Maintains the current size of the report. Fit to whole page: Adjusts the size of the report to a single page. |
| 2 | You can select the report pages you wish to save. |