Accessing Information on a Set of Map Elements
Table des matières
When you are interested in several elements in a layer, you can select them directly in the map interface using the spatial selection tools, or based on their attributes using a search.
In both cases, the selection explorer displays, showing the attributes of the selected elements. In addition, you can generate an information report for the selection.
You can have the same (or different) information in the mouseover bubbles, selection explorer, and information reports. Each of the three methods for accessing the data offers different functionality to work with it.
Performing Searches
JMap Web allows you to perform two types of searches:
- Searches for addresses and locations.
- Searches for the elements of a layer based on those elements’ attribute values. The elements selected are displayed on the map, and you can access their descriptive information.
Searching for an address or location
To perform a search:
-
Click on
 Sidebar and then click on the Search tab. The list of searches appears.
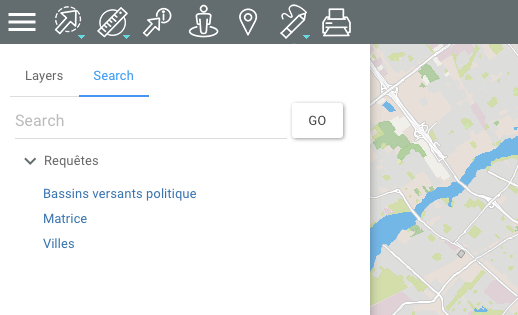
-
Enter the address or location in the Search field. As you type, options will be displayed to guide you.
-
Click on Go. The chosen location is centered in the map interface.
Searching the application layers
To search for layer elements based on the values of their attributes:
-
Click on
Sidebar and then click on the Search tab. The list of searches appears. -
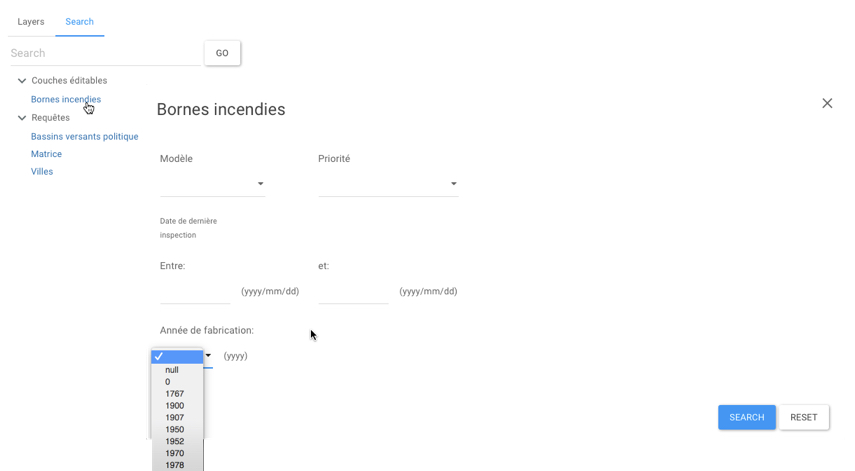
Click on the name of the search you are interested in. The search form displays.
-
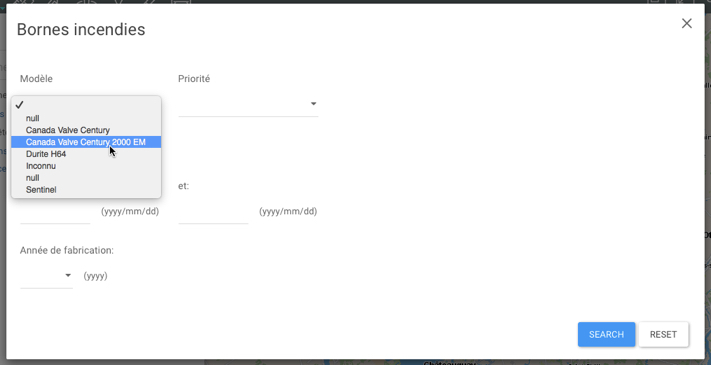
Click on the arrow
 to display the value menu of each attribute. Select the values you are looking for.
 -
You can only select data for a few attributes. For certain attributes, you can select more than one value.
-
Click on Reset if you wish to return to the empty search form and delete the values you selected.
-
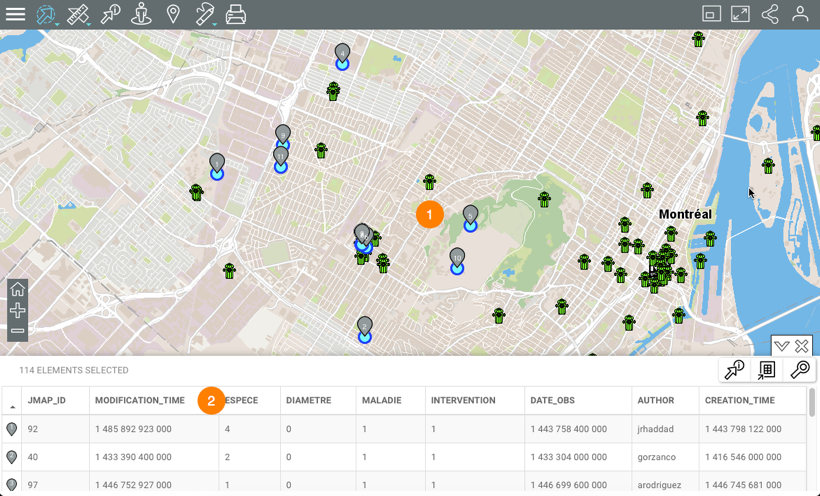
Click on Search to display the search results. The elements retrieved are identified with markers in the map interface. The selection explorer displays the attribute data for these elements.
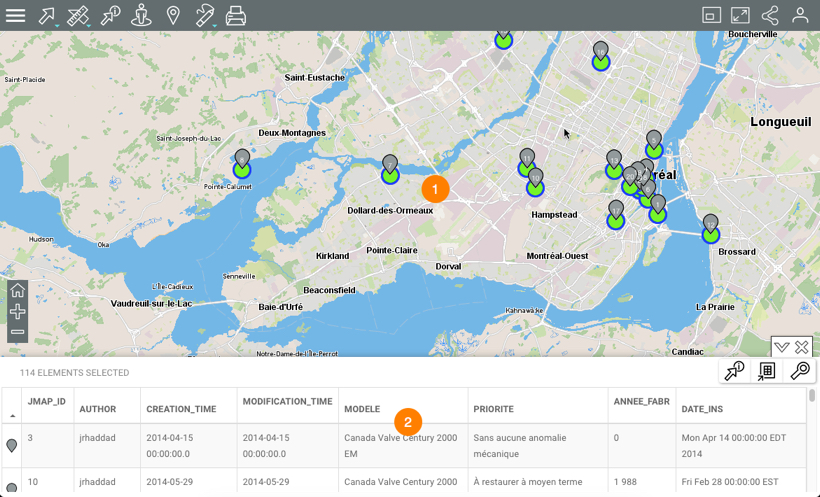
1 The elements retrieved are identified with numbered markers  and centered in the map interface.
2 The selection explorer displays the elements retrieved in rows and their attributes in columns. Various functions allow you to work with the information in the table. -
Click on the
 arrow to hide the selection explorer.
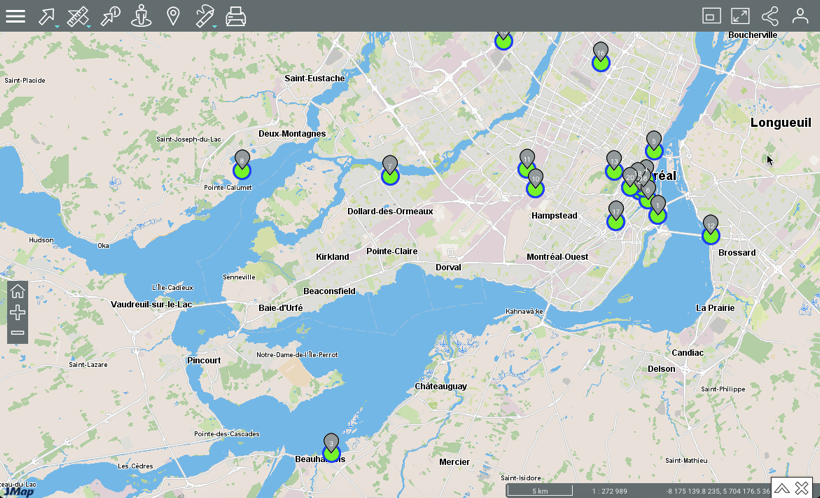
-
Click on the
 arrow to redisplay the selection explorer.
 -
Click on
 to erase the search results. The selection explorer and the markers are cleared from the map interface. The map interface maintains the same view.
Selecting Elements in the Map Interface
You can select elements of a layer directly on the map interface using the selection tools. Afterwards, you can access the selection’s descriptive information.
You can select the elements of several layers at a time; before selecting a layer’s elements, you must make that layer selectable. To do so, follow these steps:
-
Place the mouse pointer on the row of the layer you are interested in, on the right of the layer’s name. An arrow
 displays.
 -
Click on the arrow
. The arrow will turn blue  , which indicates that the layer’s elements can be selected using the interactive selection tools.
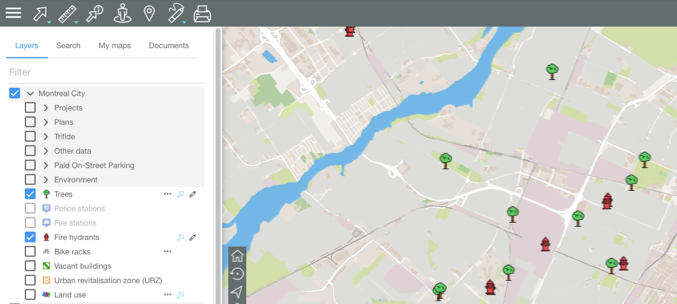
Each layer of a group can be made selectable independently from the others.
-
Click on the arrow
if you no longer want the layer data to be selectable. The arrow changes back to grey .
Selecting elements using the selection tools
To select elements directly in the map interface:
-
Click on
 Selection to display the drop-down list of selection tools.
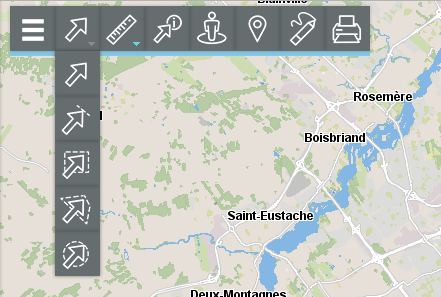
Icon 
Punctual selection
Allows you to select one element at a time.
Click on an element to select it.
Linear selection
Allows you to select one or more elements by drawing a line. Any elements the line touches will be selected.
Note: this option does not work with layers of points.
Enable the tool and draw a line on the map. If you are using a tablet, touch a point to start the line, touch the points that will constitute vertices in the line, and touch to indicate that the line is complete.
Rectangular selection
Allows you to select one or more elements by drawing a rectangle. Any elements included in the rectangle, in whole or in part, will be selected. The rectangle’s dimensions will be displayed.
Enable the tool and draw a rectangle on the map. If you are using a tablet, touch the screen to trace the first point of the rectangle, then touch the screen again to trace the opposite point of the rectangle.
Polygonal selection
Allows you to select one or more elements by drawing a polygon. Any elements included in the polygon, in whole or in part, will be selected. The polygon’s dimensions will be displayed.
Enable the tool and draw a polygon on the map. Keep pressing down, double-click or press the space bar to complete the polygon.If you are using a tablet, touch the screen once to start the polygon, touch all the points that will constitute the polygon’s vertices, then touch to indicate that the polygon is complete.
Circular selection
Allows you to select one or more elements by drawing a circle. Any elements included in the circle, in whole or in part, will be selected. The radius of the circle will be displayed.
Enable the tool and draw a circle on the map. If you are using a tablet, touch the screen to define the center of the circle, and touch the screen again to draw its radius.Note: If you are using a computer, with any selection tool, you can hold the SHIFT key of your keyboard to add elements to an existing selection.
-
Click on one of the tools to enable it. The icon of the enabled tool turns blue and displays in the toolbar.
-
Select the element or elements you are interested in. In the map interface, the selected elements will be placed in a box and identified with a marker, and the selection explorer will automatically display.
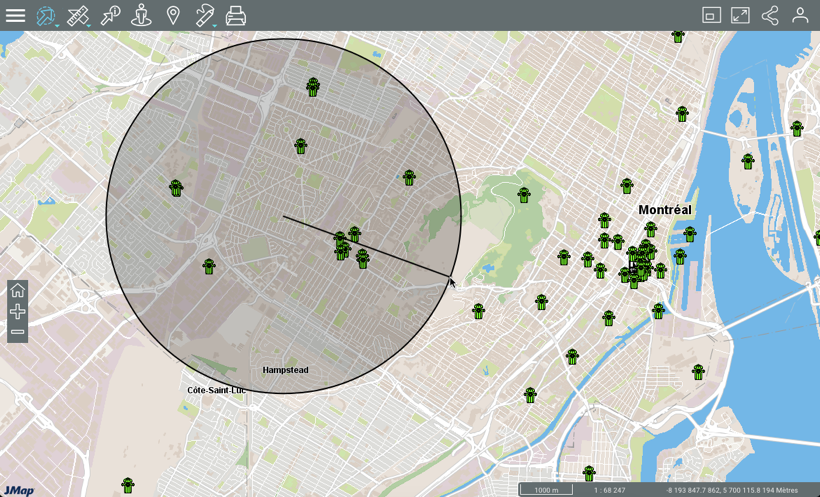
1 Selected elements are identified using numbered markers .2 The selection explorer is deployed, showing the selected elements in rows and their attributes in columns. Various functions allow you to work with the data in the table. -
Click on the arrow
to hide the results table.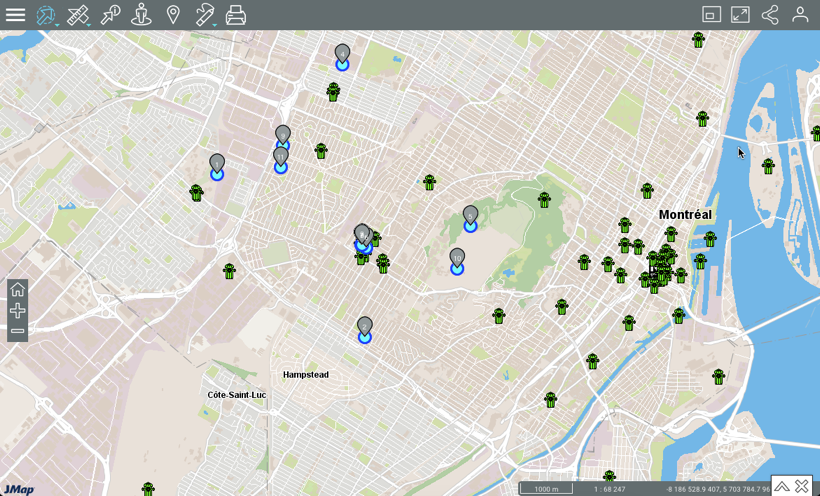
-
Click on the arrow
to redisplay the selection explorer. -
Click on
to delete the results of the selection. The selection explorer and the markers in the map interface are no longer displayed. The map interface stays in the same view.
Working with search results
Several tools are available to work with search results.
The selection explorer allows you to view and organize the attribute data of the elements retrieved.
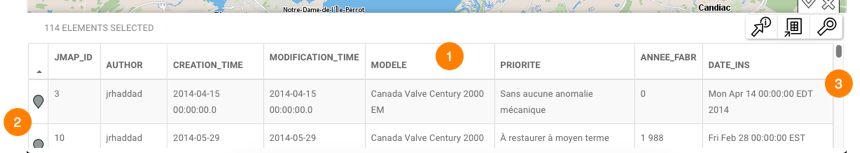
| 1 | The first line contains the names of the attributes. You can sort the data in ascending or descending order. |
| 2 | The first column contains the number of each element, indicated with a grey marker . |
| 3 | The vertical bar allows you to scroll through the table and display the elements retrieved. |
Other functions are available to select and filter data based on attribute values or to export the data to a file. The Open Table in new tab icon  opens the attributes table in a new browser tab. The table remains synchronized with the map, even if the tab is detached to open it in a new window. You cannot put the table back in the map interface. When you close the table, the selection results disappear from the map interface.
Selecting elements
Elements can be selected manually.
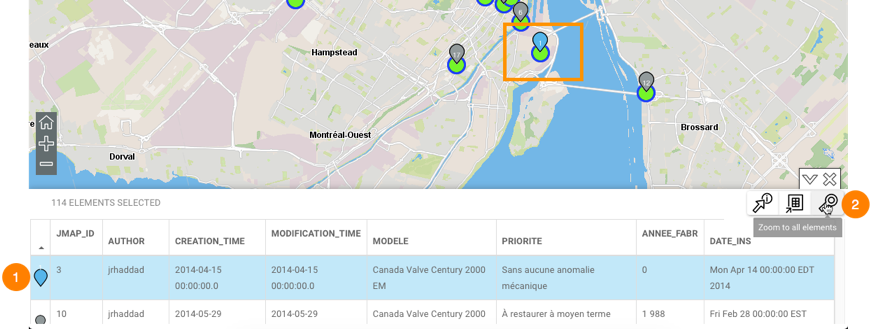
| 1 | Click on one or more elements in the explorer to select them. The grey marker turns blue  in the explorer and on the map. In the explorer, the row of each selected element turns blue. Keep pressing down on the element to center it in the map. in the explorer and on the map. In the explorer, the row of each selected element turns blue. Keep pressing down on the element to center it in the map. |
| 2 | The Zoom to all elements  icon displays all elements retrieved by the search. icon displays all elements retrieved by the search. |
Exporting data
You can export the search results to an Excel file.
1.Click on  to export the table to an Excel file. The file will be downloaded to the folder you specify.
Generating an information report
If the JMap administrator configured reports for the data layer, you can generate an information report for the elements returned by the search. The reports may have basic or advanced functionality. If no report has been configured for the layer, when you try to generate one, a message indicates that there is no report.
-
Click on
 to generate the report for the selection. The interface of the basic report is as follows:
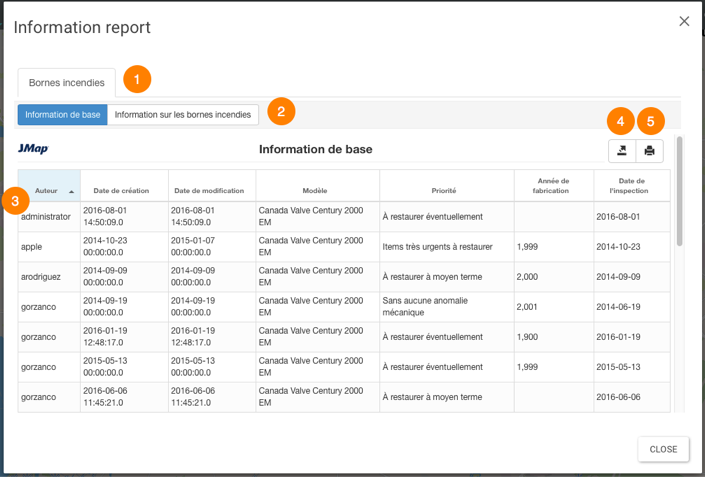
1 Name of the map layer to which the elements selected in the search belong. 2 Name of the report. 3 The table of attributes. Elements are displayed in rows, and the columns represent the element attributes. The column headers allow you to sort elements in ascending or descending order. 4 This tool allows you to export the report to an Excel file. 5 This tool allows you to print the report. -
Click on the name of the other report (if it exists) to display it. If it is an advanced report, other tools will be available:
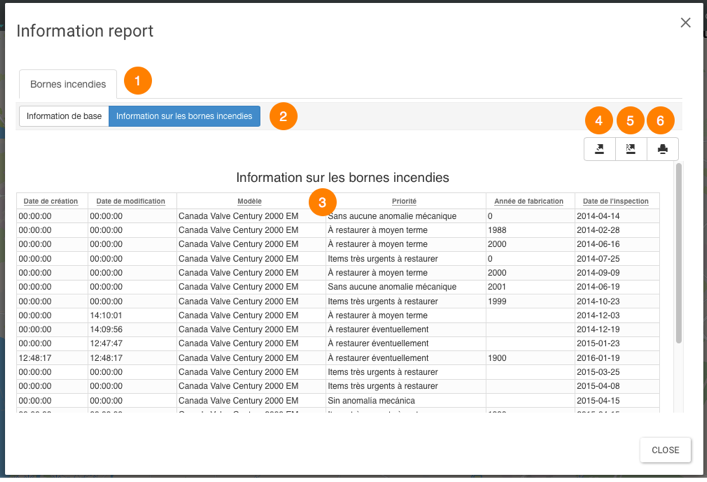
1 Name of the map layer to which the selected elements belong. 2 Name of the report. 3 This table is similar to the selection explorer. Elements are displayed in rows, and the columns represent the element attributes. The column headers allow you to sort elements in ascending or descending order. 4 This tool allows you to export attributes to a CSV file. Details are presented below. 5 This tool allows you to export the report to a file. Details are presented below. 6 This tool allows you to print the report. Details are presented below. -
Click on Close to close the report and return to the selection explorer.
Exporting report data, in whole or in part, to a file
Data contained in the advanced report can be exported to a CSV file to be processed with other software.
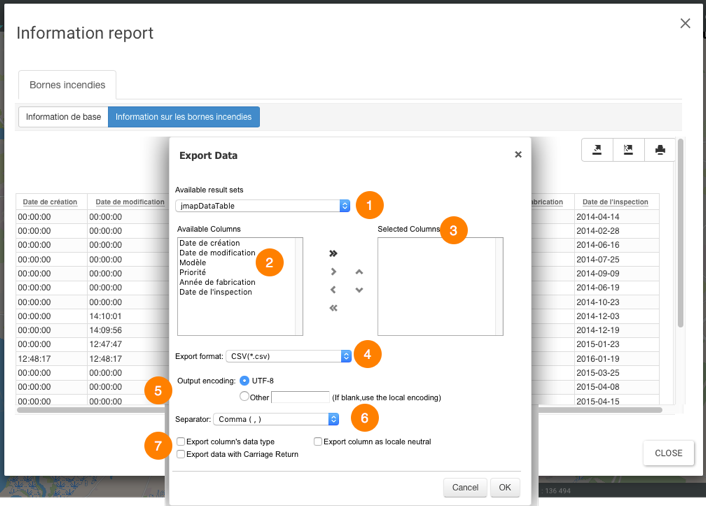
| 1 | Name of the database containing the data. |
| 2 | Attributes that contain descriptive data for the element and that are available to be exported. Using the  and and  arrows, you can select the attributes you wish to export. arrows, you can select the attributes you wish to export. |
| 3 | Attributes that are exported to the file.Using the  and and  arrows, you can remove attributes from the selection. Using the arrows, you can remove attributes from the selection. Using the  and and  arrows, you can modify the order of the attributes in the file. arrows, you can modify the order of the attributes in the file. |
| 4 | CSV is the file format. |
| 5 | You can select a type of encoding for the data. |
| 6 | You must specify a separator for the data columns. |
| 7 | You can specify a column format. This information is important to read the data with databases or other software (when the CSV file is open in Excel, for instance). |
Exporting the report to a file
The report can be exported to a file.
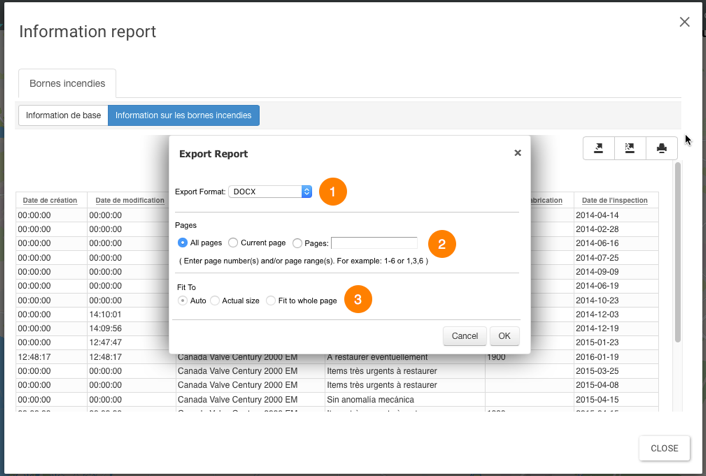
| 1 | Format of the file to which the report will be exported. The following formats are available: DOCX, Excel (XLS), OpenDocument Presentation (ODP), OpenDocument Spreadsheet (ODS), OpenDocument Text (ODT), PDF, PostScript (PS), PowerPoint (PPT), PPTX, Spudsoft Excel, Word (DOC), XLSX. |
| 2 | You can select the report pages you wish to export. |
| 3 | You can configure how the report will fit in the file. |
Printing the report
The report can be saved in a certain format for printing and sharing purposes.
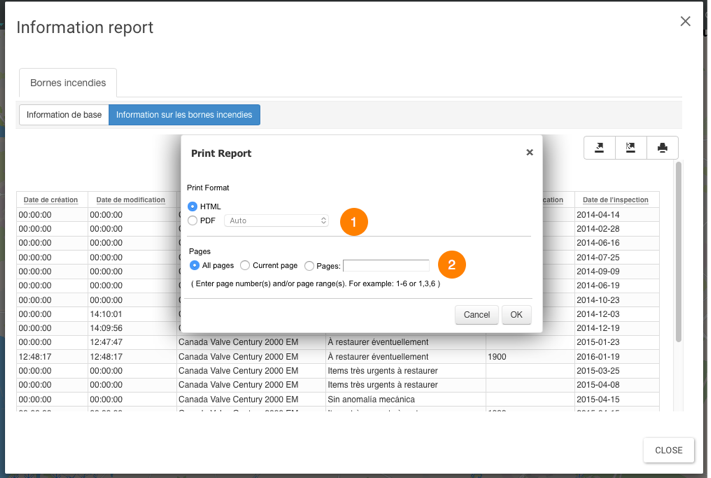
| 1 | The format in which the report will be printed. The following formats are available: HTML and PDF. PDF offers three options: Auto: Adjusts the document automatically. Actual size: Maintains the current size of the report. Fit to whole page: Adjusts the size of the report to a single page. |
| 2 | You can select the report pages you wish to print. |