Adding Annotations to the Map
Table of contents
- The Annotations panel
- Drawing tools
- Defining the style of annotations
- Modifying annotations
- Deleting annotations
You can add annotations on the map, such as drawings or text, which can be saved in PDF format with the map.
The Annotations panel
The Annotations panel contains the application’s drawing tools.
-
Click on
 to open the Annotations panel. The icon changes color
 .
.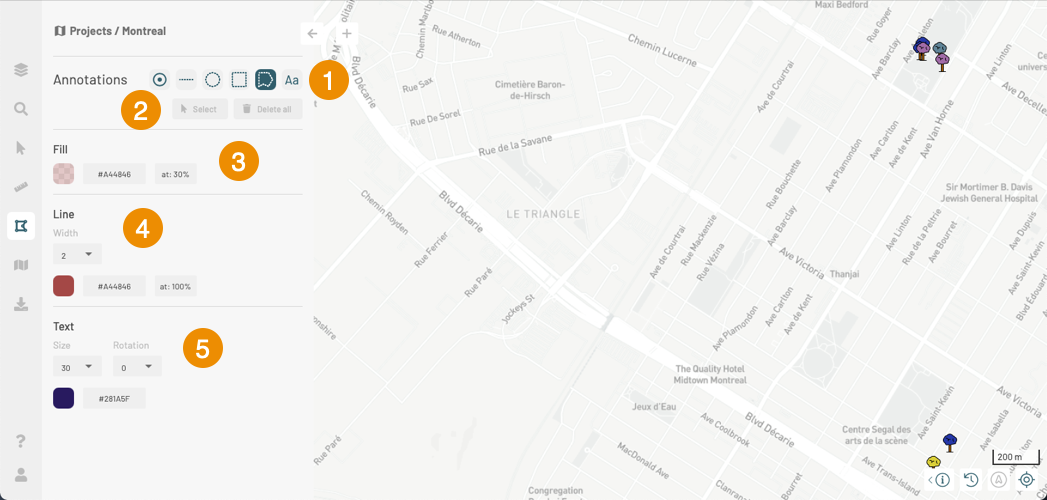
1 Tools to add various types of annotations. 2 Select
This button allows you to select annotations.
Delete all
This button allows you to delete annotations.3 Fill
These tools allow you to select the fill color and transparency for polygon type annotations. The Fill section provides details on these tools.4 Line
These tools allow you to define the width, color, and transparency of lines. The Line section provides details on these tools.5 Text
These tools allow you to define the size, rotation, and color of text added to the map. The Text section provides details on these tools. -
Click on the tool of your choice to enable it. The icon of the tool will change color. The Drawing tools section explains the features of these tools and how to use them.
-
Create the drawings you wish to add to the map. You can switch between tools to add different types of drawings. They will remain on the map until you delete them.
Drawing tools
Several tools allow you to add annotations:
| Icon | |
|---|---|
 | Point To draw points: 1. Click on to enable the tool. The icon changes color  . .2. Click where you wish to add a point on the map. The appearance of points is defined in the Fill and Line sections. You can select the features of points before drawing them. You can also modify the appearance of one or more points once they have been created. |
 | Line 1. Click on to enable the tool. The icon changes color  . .2. Click where you wish to add the first point of the line. 3. Click somewhere else to add a vertex to the line. 4. Double-click to complete the line. The appearance of lines is defined in the Line section. You can select the features of a line before drawing it. You can also modify the appearance of one or more lines once they have been created. |
 | Circle 1. Click on to enable the tool. The icon changes color  . .2. Click where you wish to draw the center of the circle. 3. Drag the pointer to draw the circle. 4. Click to complete the circle. The appearance of circles is defined in the Fill and Line sections. You can select the features of a circle before drawing it. You can also modify the appearance of one or more circles once they have been created. |
 | Rectangle 1. Click on to enable the tool. The icon changes color  . .2. Click where you wish to draw the first vertex of the rectangle. 3. Drag the pointer to draw the rectangle. 4. Click to draw the opposite vertex and complete the rectangle. The appearance of rectangles is defined in the Fill and Line sections. You can select the features of a rectangle before drawing it. You can also modify the appearance of one or many rectangles once they have been created. |
 | Polygon 1. Click on to enable the tool. The icon changes color  . .2. Click where you wish to draw the first vertex of the polygon. 3. Click to draw the vertices of the polygon. 4. Double-click to draw the last vertex and complete the polygon. The appearance of polygons is defined in the Fill and Line sections. You can select the features of a polygon before drawing it. You can also modify the appearance of one or more polygons once they have been created. |
 | Text 1. Click on to enable the tool. The icon changes color  . .2. Click where you wish to add text on the map. The text entry interface opens. 3. Enter your text. 4. Click OK to save the text or click Cancel to close the interface without saving the text. The appearance of text is defined in the Text section. You can select the features of your text before entering it. You can also modify the appearance of one or more text entries once they have been created. |
Defining the style of annotations
Fill
This section allows you to define the fill color and transparency for points, circles, rectangles, and polygons.
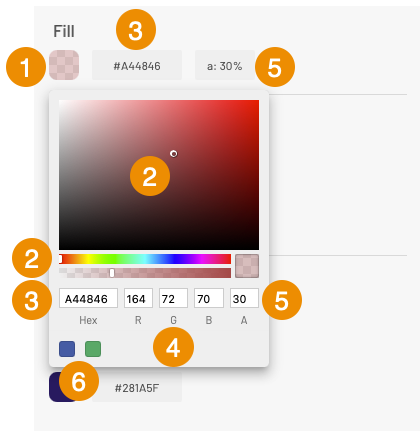
| 1 | This box shows the selected color and its level of transparency. 1. Click on the box to open the fill color selection tool. This tool offers several ways to define the color. |
| 2 | Visual tools to select the color: 1. Select the color in the color bar by sliding the cursor. 2. Select the shade in the color field by sliding the point. The selected color is displayed in the Hex and RGB fields and also appears in the color box. |
| 3 | Hexadecimal (hex) code of the selected color. 1. Enter the hexadecimal code in the Hex field. The color you enter is shown in the box, in the colored bar, in the color field and in the RGB indicators. The Hexadecimal code is displayed in the Fill section at all times. |
| 4 | The color is also set using the RGB code. 1. Enter the R, G and B values of the desired color. All the color indicators display the selected color. |
| 5 | This field shows the level of opacity of the fill color. 1. Select the level of opacity in the second bar by sliding the cursor. Sliding the cursor completely to the right allows you to reach maximum opacity, and sliding it all the way to the left will set the value to maximum transparency. You can also enter the value in the A box. The level of opacity is displayed at all times as a percentage value in the Fill section. |
| 6 | The last selected colors are kepeed in memory. |
Line
This section allows you to define the appearance of lines that make up linear drawings as well as the outlines of circles, polygons, rectangles, and points.
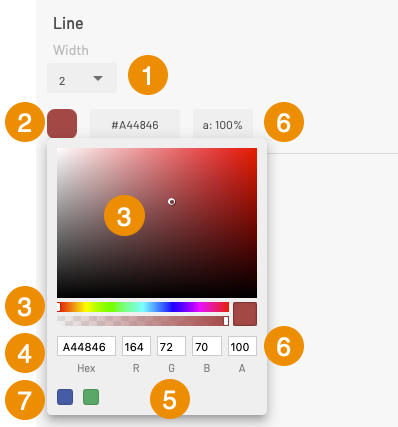
| 1 | Width To define the width of the line, select a value in the drop-down list. |
| 2 | This box displays the color selected for the line and its level of transparency. 1. Click on the box to open the line color selection tool. This tool offers several ways to define the color. |
| 3 | Visual tools to select the color: 1. Select the color in the color bar by sliding the cursor. 2. Select the shade in the color field by sliding the point. The selected color is displayed in the Hex and RGB fields and also appears in the color box. |
| 4 | Hexadecimal (hex) code of the selected color. 1. Enter the hexadecimal code in the Hex field. The color you enter is shown in the box, in the colored bar, in the color field and in the RGB indicators. The Hexadecimal code is displayed in the Line section at all times. |
| 5 | The color is also set using the RGB code. 1. Enter the R, G and B values of the desired color. All the color indicators display the selected color. |
| 6 | This field shows the level of opacity of the line. 1. Select the line’s opacity level in the second bar by sliding the cursor. Sliding the cursor completely to the right allows you to reach maximum opacity, and sliding it all the way to the left will set the value to maximum transparency. You can also enter the value directly in the A box. The level of opacity is displayed at all times as a percentage value in the Line section. |
| 7 | The last selected colors are kepeed in memory. |
Text
This section allows you to define the appearance of text entered on the map.
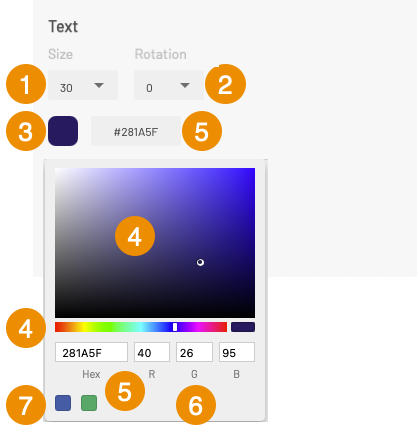
| 1 | Size To set the font size, select a value in the drop-down list. |
| 2 | Rotation Indicate the rotation angle you wish to apply to the text. |
| 3 | This box displays the color selected for the text. 1. Click on the box to open the text color selection tool. This tool offers several ways to define the color. |
| 4 | Visual tools to select the color: 1. Select the color in the color bar by sliding the cursor. 2. Select the shade in the color field by sliding the point. The selected color is displayed in the Hex and RGB fields and also appears in the color box. |
| 5 | Hexadecimal (hex) code of the selected color. 1. Enter the hexadecimal code in the Hex field. The color you enter is shown in the box, in the colored bar, in the color field and in the RGB indicators. The Hexadecimal code is displayed in the Text section at all times. |
| 6 | The color is also set using the RGB code. 1. Enter the R, G and B values of the desired color. All the color indicators display the selected color. |
| 7 | The last selected colors are kepeed in memory. |
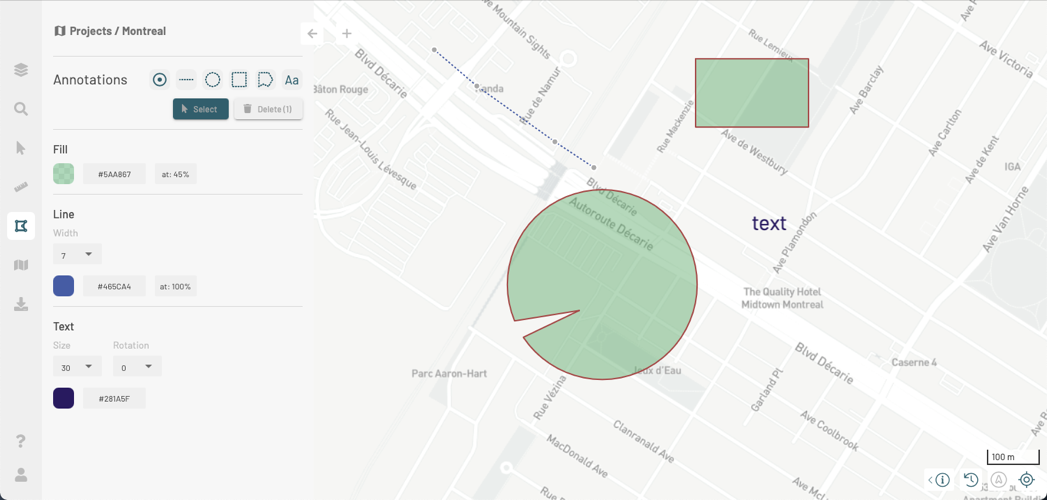
Modifying annotations
You can make changes to the annotations and drawings you add to the map. You can change the shape of one drawing at a time. You can change an annotation’s appearance and its location or delete several drawings at once.
Modifying the appearance of drawings or text
-
Click on Select to select the drawings or text entries you wish to modify.
-
Click on a text entry or a drawing to select it. The appearance of the drawing’s lines will change, and the text will become bold, indicating that the annotation is selected.
-
Hold the SHIFT key and click on another drawing or text entry to add it to your selection. You can select several text entries or several drawings (circles, points, rectangles or polygons). You cannot select both text and drawings at the same time.
-
Depending on the type of annotation in your selection, and using the Fill, Line and Text tools, change the appearance of the annotations. The changes will be displayed on the map.
-
Click on another annotation or on the map to unselect the annotations.
Changing the shape of a drawing
-
Click on Select to select the drawings you want to modify.
-
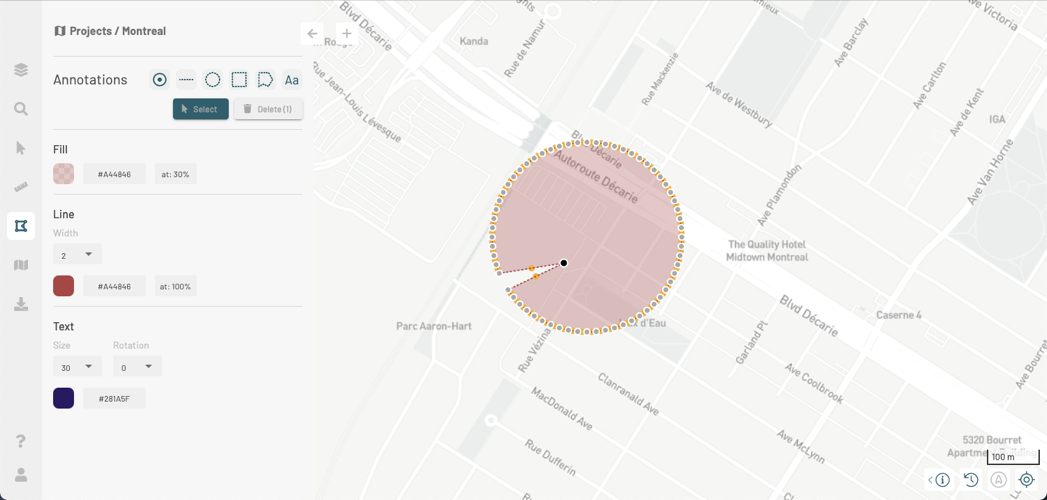
Click on a drawing to select it. The vertices of the drawing appear.
-
Click on a vertex to select it. The vertex will turn black. New orange vertices are displayed between the original vertices.
-
Slide the selected vertex to the desired location. The drawing will be modified accordingly.
-
Make the changes by selecting the vertices you want to work with.
-
Click on another annotation, or click on the map to unselect the annotation.
Modifying the location of annotations
You can change the location of annotations. You can only move one text entry at once, but you can move several drawings at the same time.
Moving a text entry
-
Click on Select to select the text entry you wish to move.
-
Click on a text entry to select it. The text becomes bold, indicating that it is selected.
-
Using the hand-shaped pointer, click on the text, then drag it to the desired location.
-
Drop the text.
-
Click on another annotation or on the map to unselect the text.
Moving drawings
-
Click on Select to select the drawings you wish to move.
-
Click on a drawing to select it. The appearance of the drawing’s lines will change, indicating that the annotation is selected.
-
Hold the SHIFT key and click on another drawing to add it to your selection.
-
Using the pointer that is shaped like a hand when it’s on one of the drawings, drag the drawings to the desired location.
-
Drop the drawings.
-
Click on another annotation, or click on the map to unselect the drawings.
Deleting annotations
-
Click on Select to select the drawings or text entries you wish to delete.
-
Click on a text entry or a drawing to select it. The appearance of the drawing’s lines will change, and the text will become bold, indicating that the annotation is selected.
-
Hold the SHIFT key and click on another text entry or drawing to add it to your selection. You can select several text entries or drawings (circles, points, rectangles or polygons). You cannot select both text and drawings at the same time. The Delete button indicates the number of selected annotations.
-
Click on Delete to delete the selected annotations.