The Data
Table of contents
Project data is organized into layers. Each layer contains data related to a specific theme. Layers are superimposed on one another to form the map that is displayed in the interface.
Some layers are comprised of objects or elements that are represented using a type of geometry (points, lines, polygons) and descriptive attributes. For example, a layer can represent trees using points, and the attributes associated with them can include the species of tree, diameter, height, and state of health. Thus, each object (tree) of the layer has a geometry that is located in space and attributes that describe it.
Other layers are comprised of raster data (pixels) that form images, such as aerial photographs or satellite images.
Layers can be grouped hierarchically based on themes, such as urban planning, the environment, transportation, etc. A multi-level hierarchical structure makes it easier to work with projects when they contain many layers and different themes.
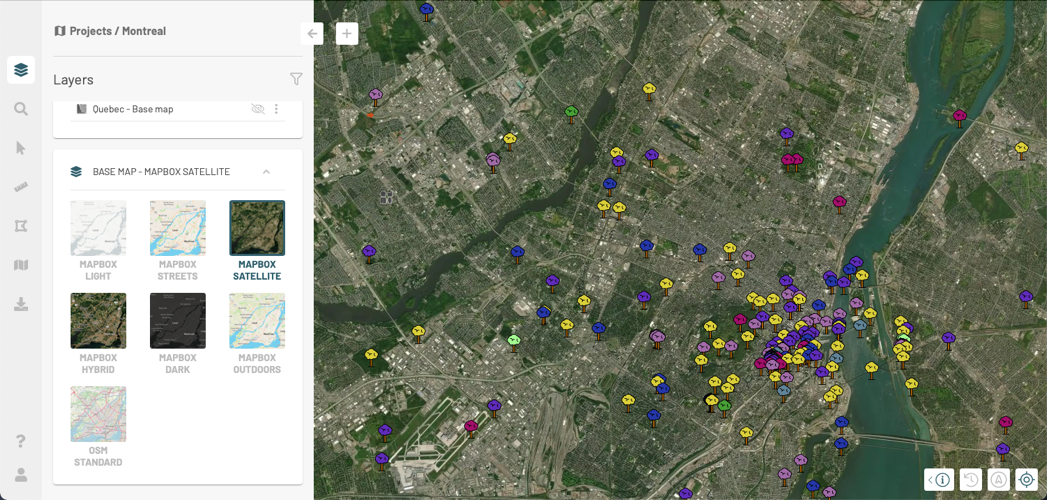
Certain layers are called base maps because they provide a context to display the data layers. Interaction with base maps is limited to selecting the base map to be displayed in the application.
The Layers panel
The Layers panel contains the details of the project’s layers and tools to control how they are displayed.
-
Click on
 to open the Layers panel. The icon changes color
  .
.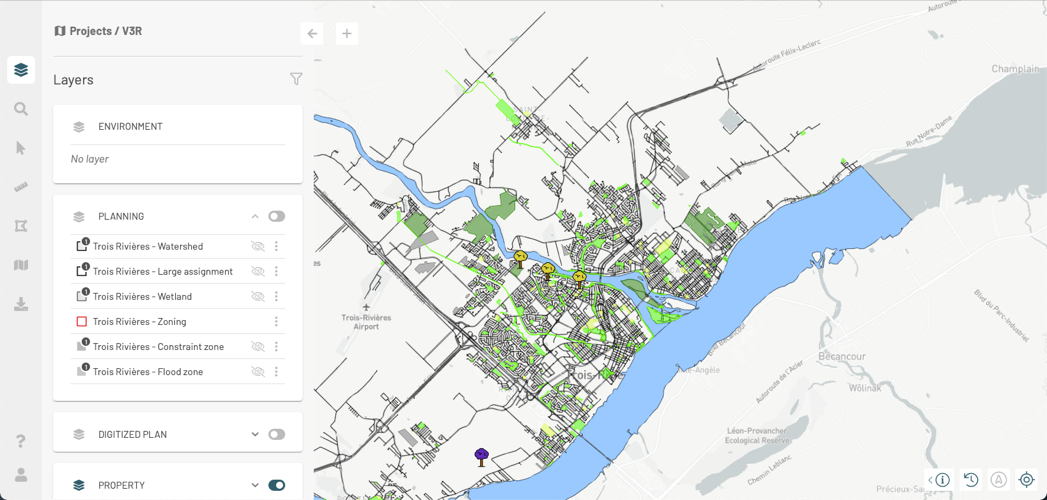
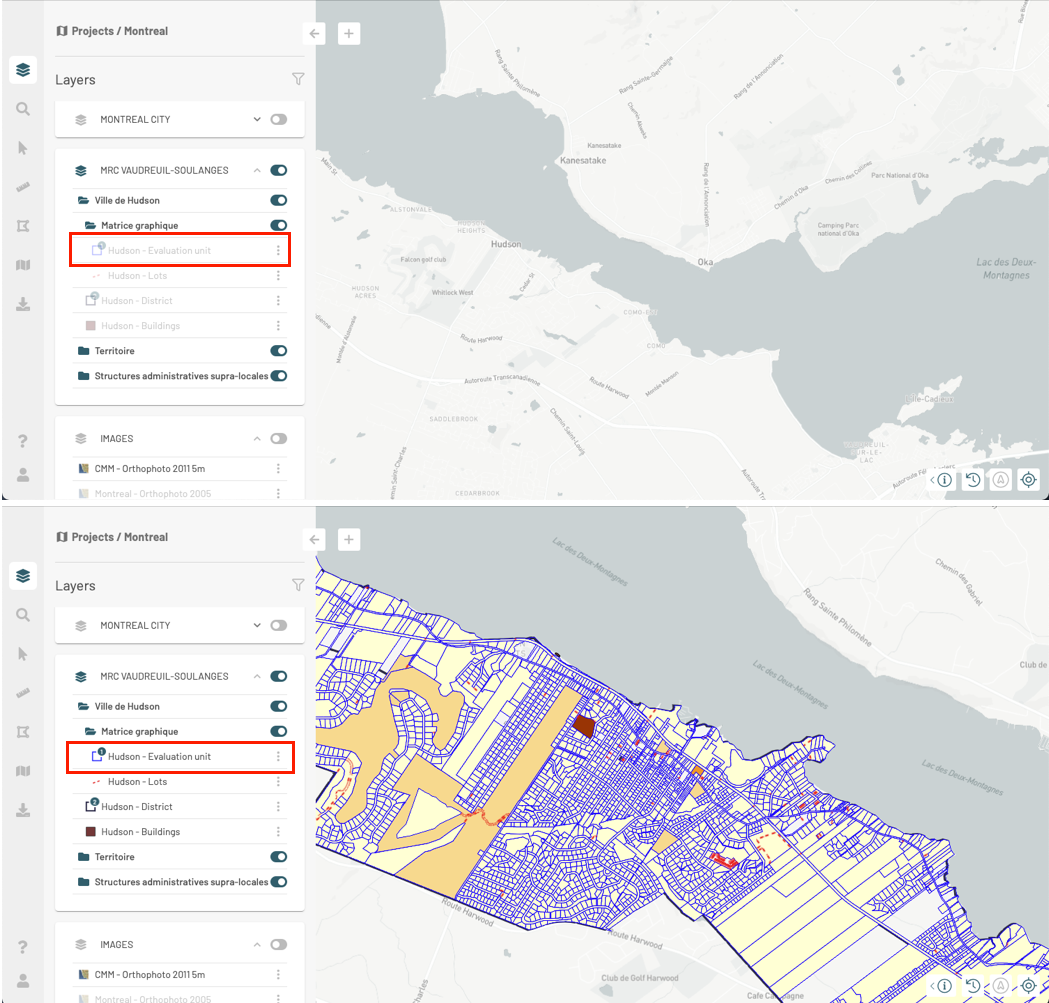
Within a project, groups of layers appear in the panel in the form of cards. A group can be opened to display its subgroups and layers, or it can be closed to show only its name.
-
Click on the arrow
 in the card of a group to open it. The subgroups and layers it contains will be displayed.
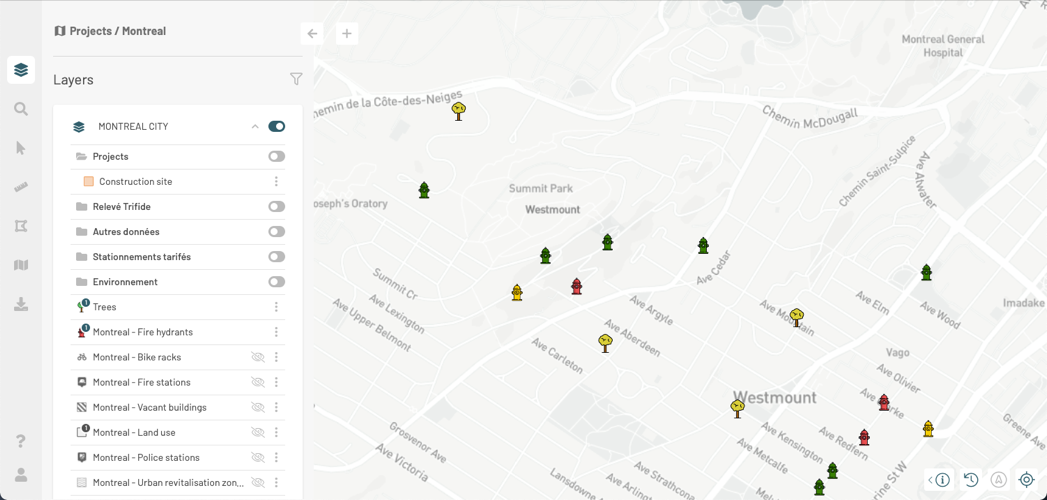
Each subgroup and layer has a card that presents different functions and details of the subgroup or layer. A subgroup is displayed using the
 icon, and a layer is displayed using an icon representing its style.
 -
Click on the
icon to open the subgroup card and display the layers it contains. The icon changes to  , indicating that the subgroup has been deployed.
 -
Click on the
icon to close the subgroup card. -
Click on
 to close the group of layers card.
 -
Select a base map from the BASE MAP group. The name of the selected map is displayed with the name of the group.
-
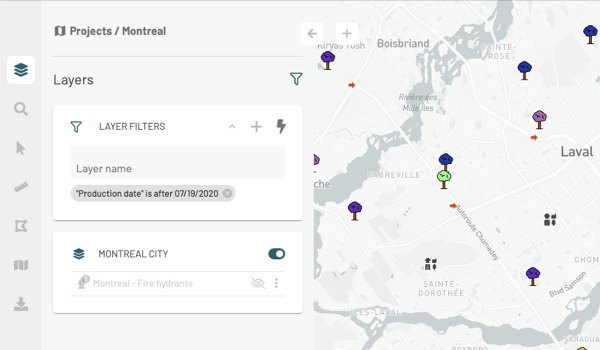
To speed up the identification of the layers that interest you, you can apply a filter. Click on
 to open the function Layer filters.
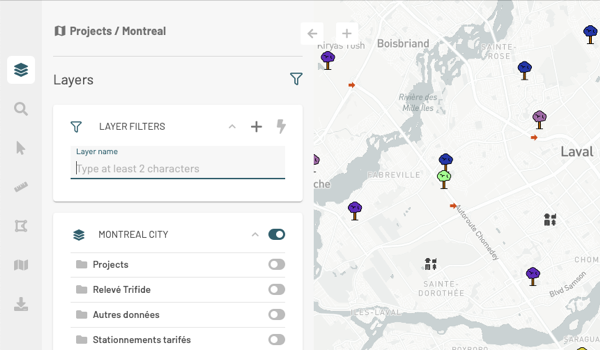
-
Enter characters in the range Layer Name to filter the layers based on their name.
-
Click on
 to open the Add a filter card.
 -
Select the attribute from the Filter by list, the operator from the **Operator ** list, and the value by which you want to filter the layers.
-
Click Add. The filter is displayed in the Layer filters box. Only the layers that pass the filter are displayed in the Layers panel.
-
Click on
 to apply the filter to the map. Only the layers which pass the filter and whose display is activated are displayed in the map.
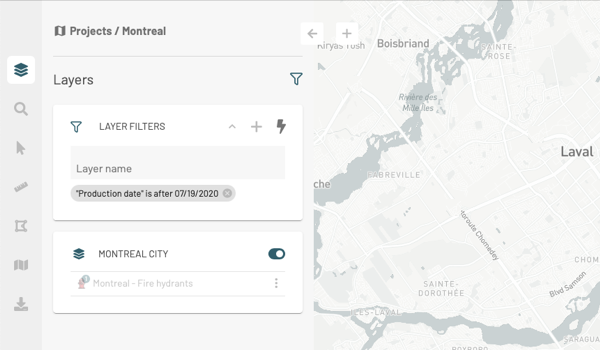
-
Click on
 to remove the layer filter. The layers appear in the Layers panel. You must turn on the display of layers to view them in the map.
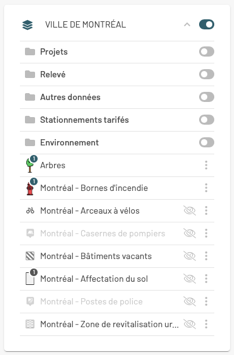
Displaying layers
You can select the layers to display in the map. To display a layer, you must display the group and the subgroups in which the layer is found.
-
Slide the switch on the group’s card from
 to
to  in order to enable the display of the group.
 -
Click on
to open the group card and display the layers and subgroups it contains. -
Slide the switch on the subgroup’s card to enable its display. The icon of the subgroup will change color
 .
.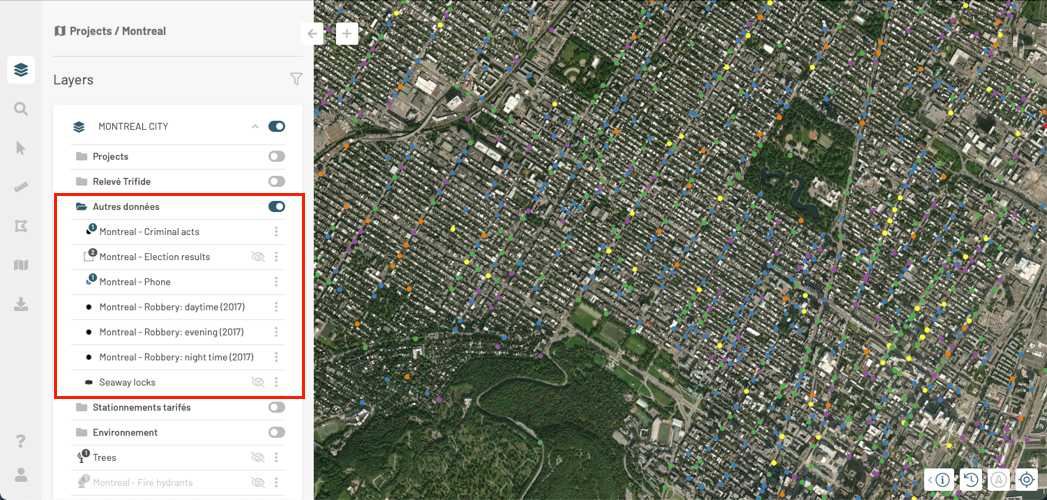
The
 icon appears in the layers’ cards whose display is disabled. No icon appears in layers’ cards whose display is enabled.
 -
Click on
to display the layer. The icon disappears, and the layer is displayed in the map.
-
To disable the display of a layer, bring the mouse pointer to the card of that layer. The
 icon appears.
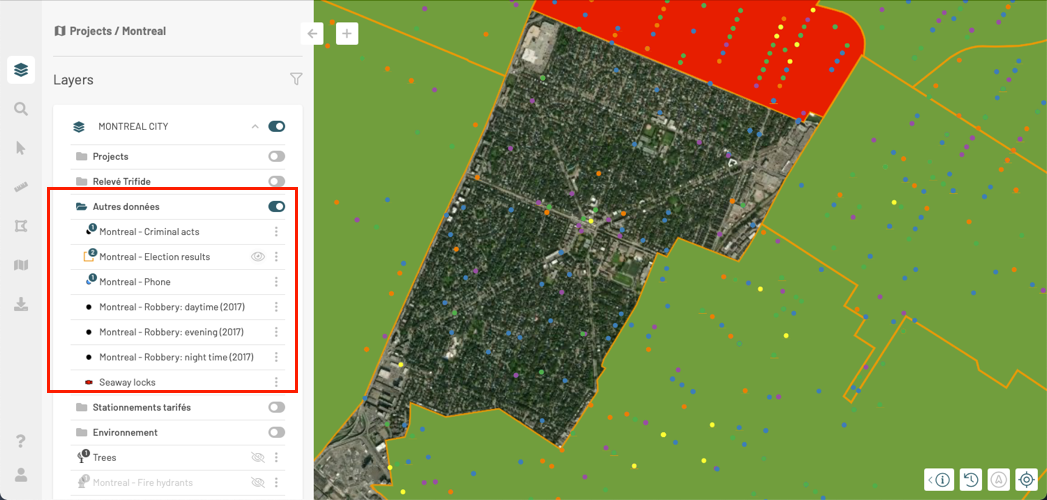
-
Click on the
icon, which turns to . The layer will no longer be displayed in the map. Its symbol will turn gray. -
Slide the display switch of the group
to this position if you wish to disable the display of all layers comprising this group. Even the layers whose display is enabled will no longer be shown.
Displaying layers based on the map scale
Some layers are configured to be displayed within a given scale interval. Displaying an abundance of small map elements when a small scale is selected (i.e. when the map displays a large territory with few details) can make it very difficult to read the map. Layers that have elements with these characteristics are usually displayed at a larger scale, when the map contains more details on a limited territory.
When a layer is not visible because of the map scale, its name and symbol will appear in very light gray. When you change the scale, these colors will become darker, indicating that the layer appears in the map if its display is enabled.
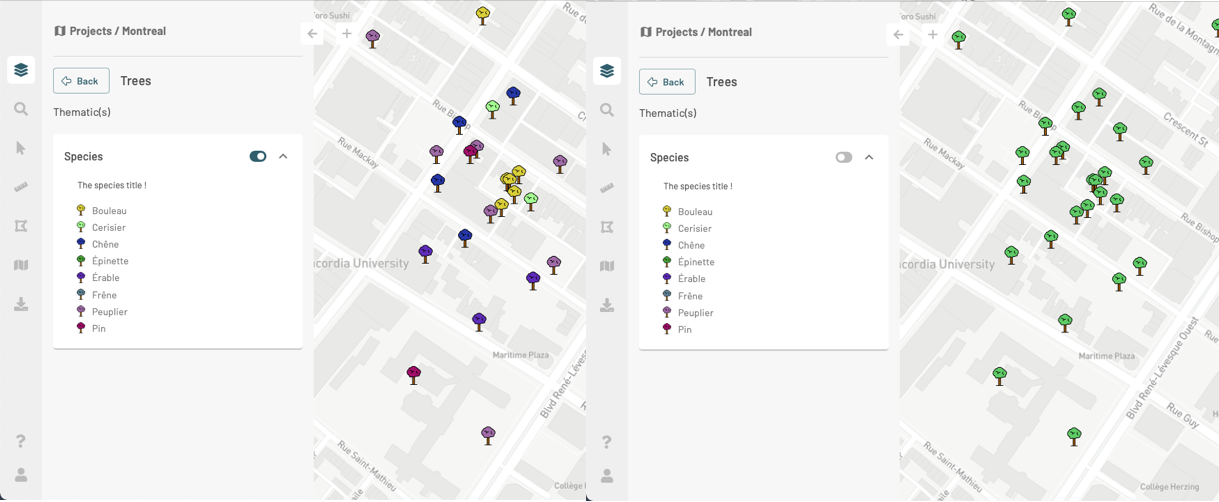
Displaying the thematics of a layer
Layers can have thematics. When thematics are present on a layer, the appearance of that layer’s elements will vary based on one or more attributes.
The number of thematics a layer possesses is displayed on its icon.
To access a layer’s thematics:
-
Click on the icon of a layer to display its thematics. The Thematic(s) card opens, displaying the legend of the thematic.
-
Use the switch to enable or disable one of the thematics. The appearance of the icons representing the layer’s objects will change according to your choice.
-
Click on
or to close or open the thematic’s card. -
Click on Back to return to the Layers panel.
Functions associated with layers
The  icon located on the card of each layer allows you to access various features: you can display the map with the geographic extent of the layer or make the layer data selectable, which allows you to edit it, for instance.
Displaying the geographic extent of the layer
To display the geographic extent of a layer, even if it is not displayed in the map:
-
Click on the
icon to open the menu. -
Click on Zoom to layer extent. The map automatically displays the area corresponding to the extent of the layer.
-
Click on
 if you wish to return to the previous geographic extent.
Making layer elements selectable
To perform certain actions, such as editing data or selecting layer elements interactively using the selection tools, you must first make the layer elements selectable.
-
Click on the
icon of the layer you are interested in to open the menu. -
Click on Make layer selectable. The
 icon is displayed in the card of the layer.
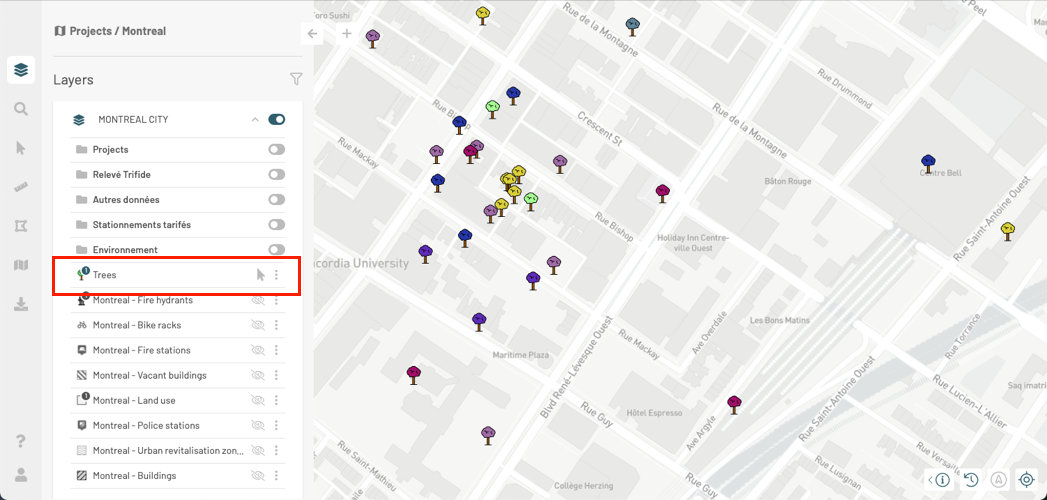
-
If you do not want the elements of a layer to be selectable, click on the
icon or click on to open the menu. -
Click on Make layer unselectable. The
icon is no longer displayed.