Accessing Project Information
Table of contents
- Displaying project information
- Selecting projects
- Obtaining a tabular list of projects
- Downloading a PDF report
- Downloading a report in Excel format
- Tracking project changes
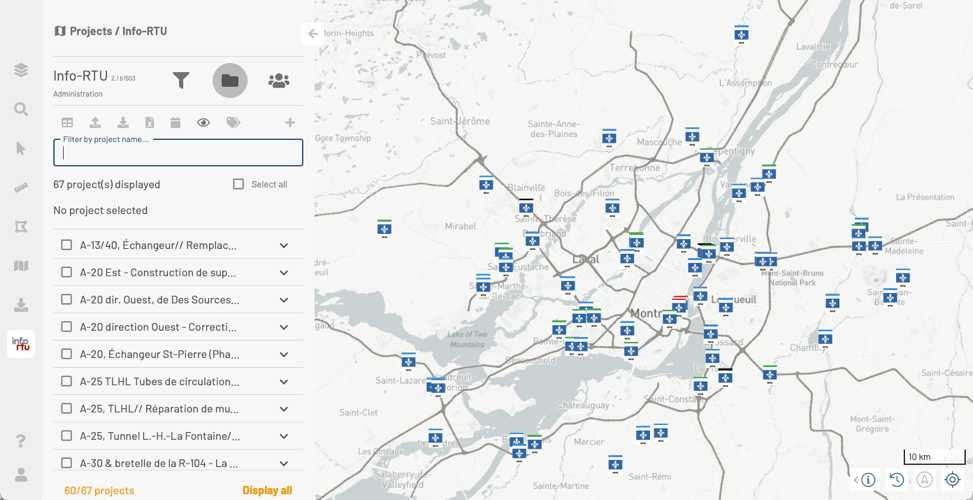
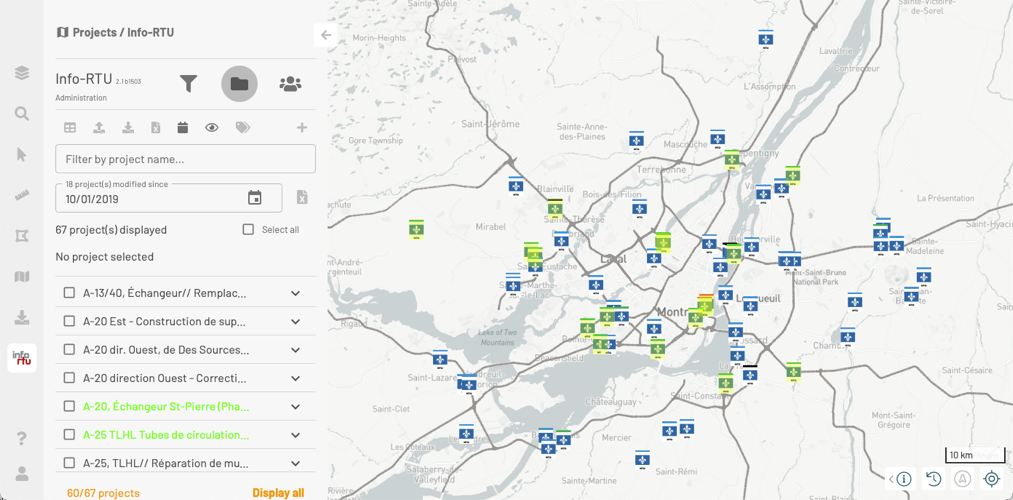
Once you apply a filter, the projects that meet the filter criteria are automatically displayed in the map and in a list in the  Projects section of the Info-RTU panel.
The Projects section contains different tools to view the project information.
| Features | |
|---|---|
 | Opens a table containing information on the displayed projects. See Obtaining a tabular list of projects for details on this feature. To close the table, click on this button. |
 | Allows you to import projects from an Excel file. See Importing a set of projects from an Excel file for details on this feature. |
 | Allows you to export projects towards a file in Shapefile format. See Exporting projects in Shapefile format for details on this feature. |
 | Allows you to download project information displayed in an Excel file. See Downloading a report in Excel format for details on this feature. |
 | Displays projects that have been edited as of the date you specify. See Tracking project changes for details on this feature. |
 | Allows you to display or hide project icons on the map. |
 | Displays the legend of the projects in a new browser window.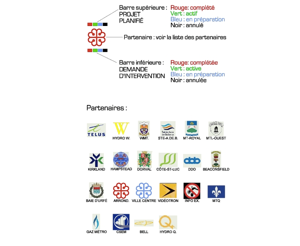 |
 | Allows you to create a new project. See Creating a New Project for details on this feature. |
| Filter by project name… | This field allows you to filter the list of projects displayed in the Projects panel based on their name or part of their name. 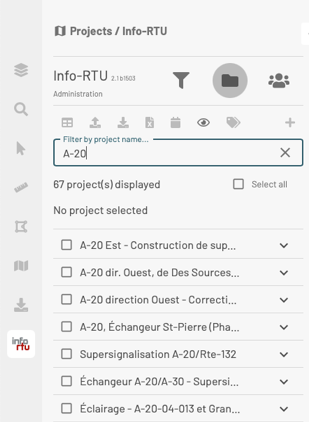 |
| xx project(s) displayed | Indicates the number of projects whose details match the filter criteria and who therefore are displayed on the map and in the list of the Projects section. |
| Select all | Check this option to select all projects. See Selecting projects for details on the available features for selected projects. |
| No project selected | This legend is displayed when none of the projects in the list are selected. It changes to xx project(s) selected when xx projects are selected. For details on this topic, see Selecting projects. |
 | By selecting this box, you select the project and can access its information. You can check several boxes to select several projects. For details on the features that are available for selected projects, see Selecting projects. |
| Allows you to open the card containing the project’s information. For details on this feature, see Displaying project information. | |
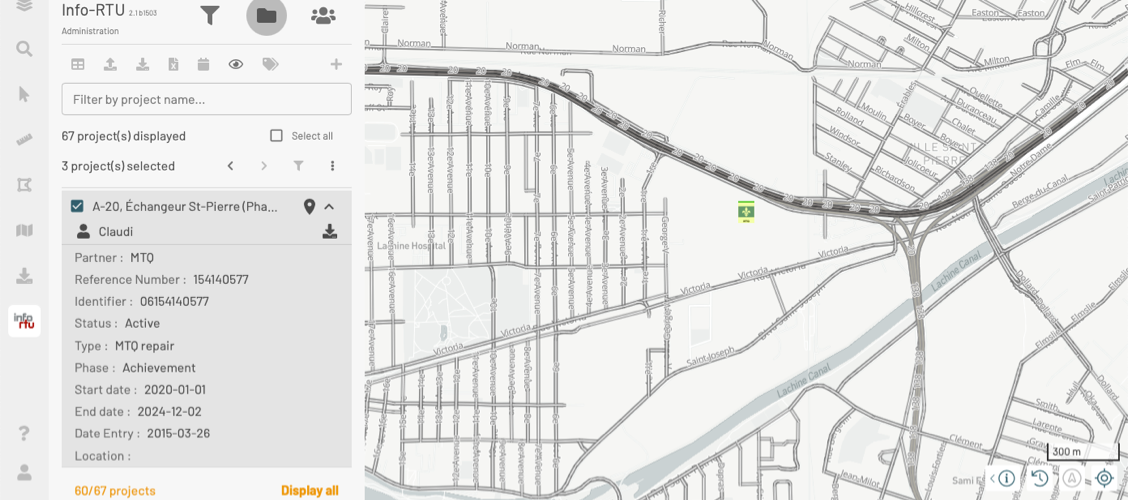
 | The Display location icon appears when you touch the name of the project.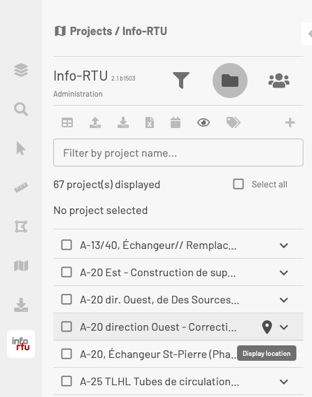 Click on to have a project centered in the map. That project’s icon will flash and turn yellow for ease of identification. 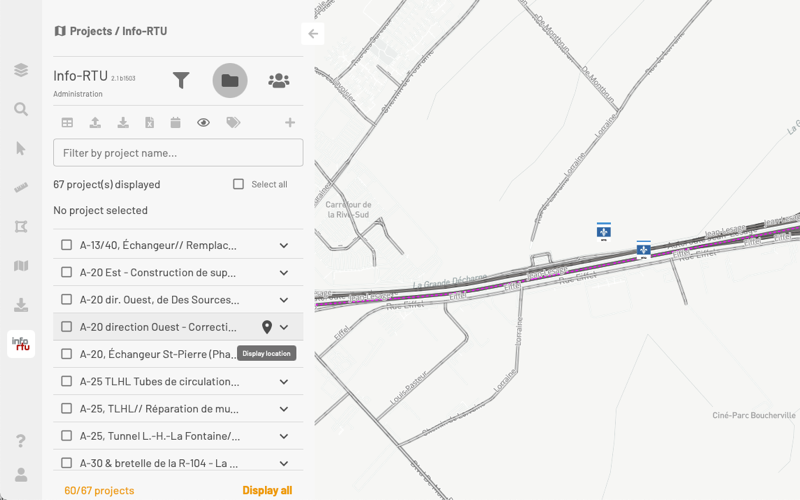 |
| xx/xx projects | Shows the number of projects displayed in the list out of the total number of projects that match the filter criteria. |
| Display all | Click to open the table that will display all of the projects that meet the filter criteria. For details on the table’s features, see Obtaining a tabular list of projects. |
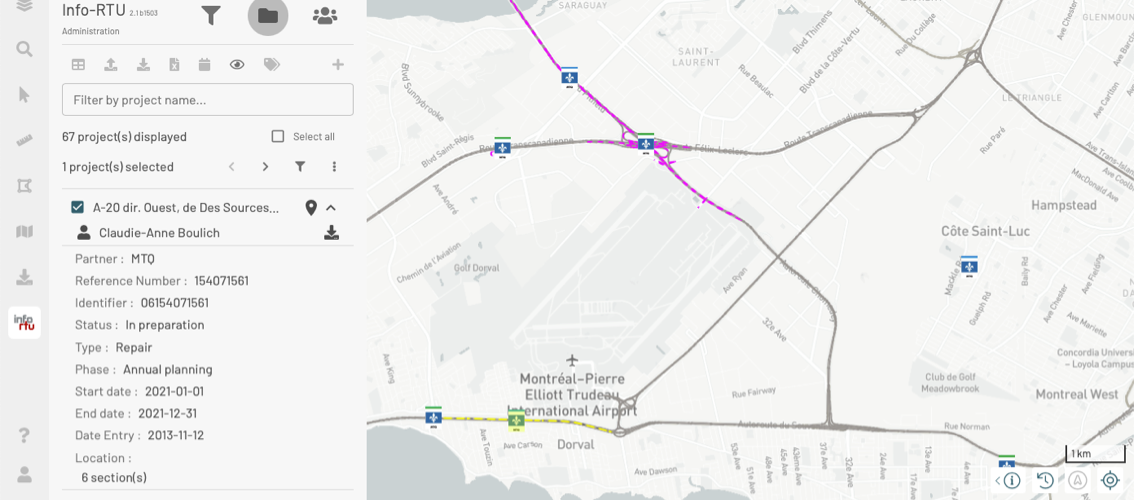
Displaying project information
Each project displays a card containing information, such as the partner involved, the contact person, the type of project, etc.
-
Click on the arrow
 to open the project’s information card.
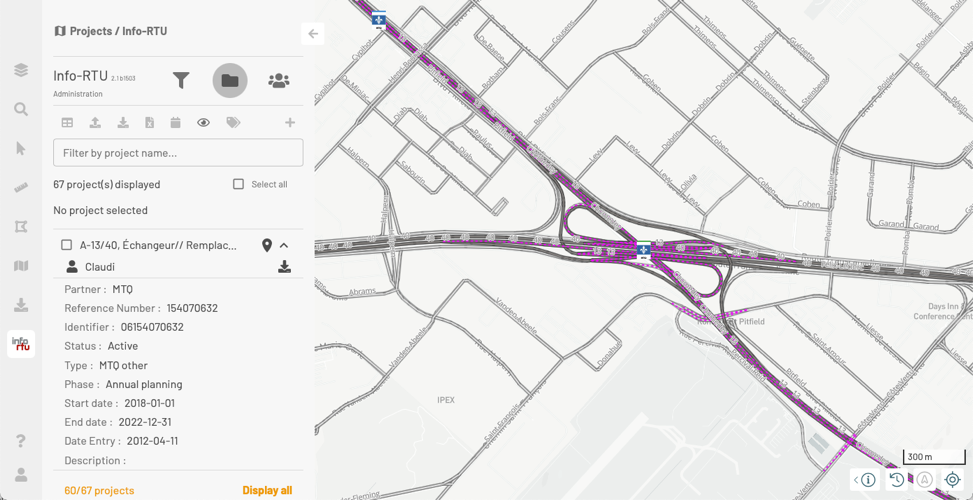
-
Click on
to center the project in the map. The project’s icon will flash and turn yellow for ease of identification. -
Click on
 Download project PDF report to download a PDF report containing the project’s details.
 -
Click on
 to display the information of the project’s contact person.
 -
Click on
 to hide the information of the project’s contact person.
 -
Click on
 to close the project’s information card.
Selecting projects
There are several ways to select one or more projects in order to display their information in different formats. You can do so:
-
From the list in the Projects section of the Info-RTU panel;
-
From the map, when you are in the Projects section of the Info-RTU panel;
-
From the Selection section in JMap NG.
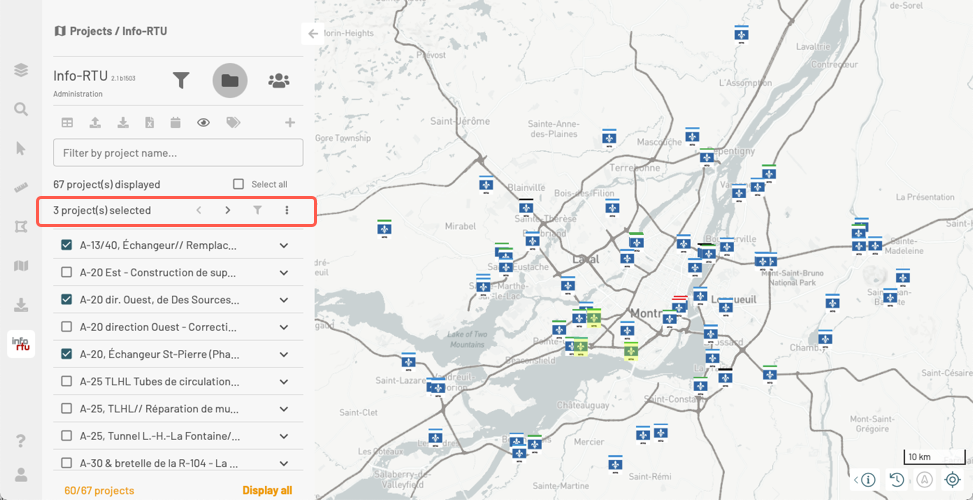
Selecting projects from the list
To select one or more projects:
-
Check the box to the left of the name of the project(s) you wish to select.
The icons of each project on the map will flash for ease of identification. They will also remain yellow.
In the panel, a legend displays, indicating the number of selected projects. Certain features will also become available, depending on your access permissions.
-
Click on
 to display only the selected projects.
 -
Click on
 to open the menu offering other features. The available features depend on your permissions.
If you do not have permission to edit one of the selected projects, the only available feature will be Download PDF, which allows you to download a report in PDF format containing information on the selected projects.
If you have permission to edit all of the selected projects, the menu will offer other options. For details on these features, see Editing Projects and Deleting a Project.
-
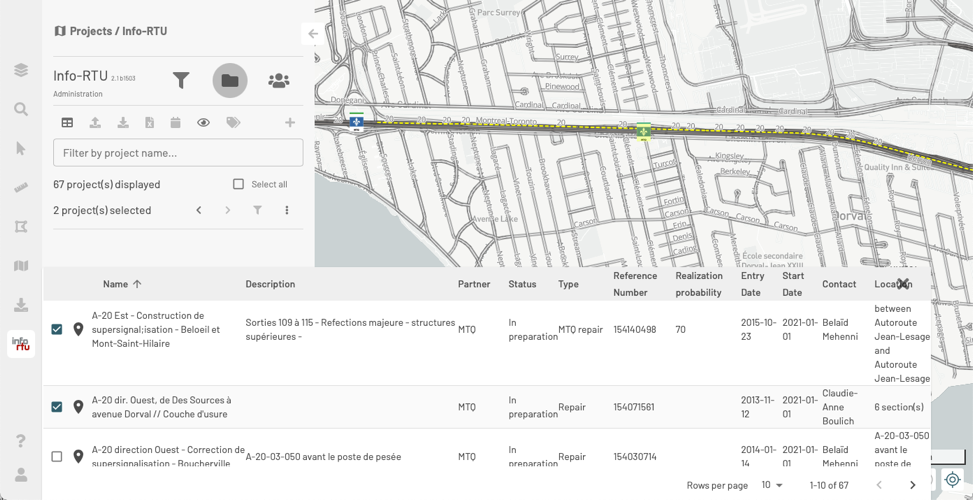
Click on the arrow
 . The information card of the first selected project opens. The location of that project is centered in the map, and its icon is yellow.
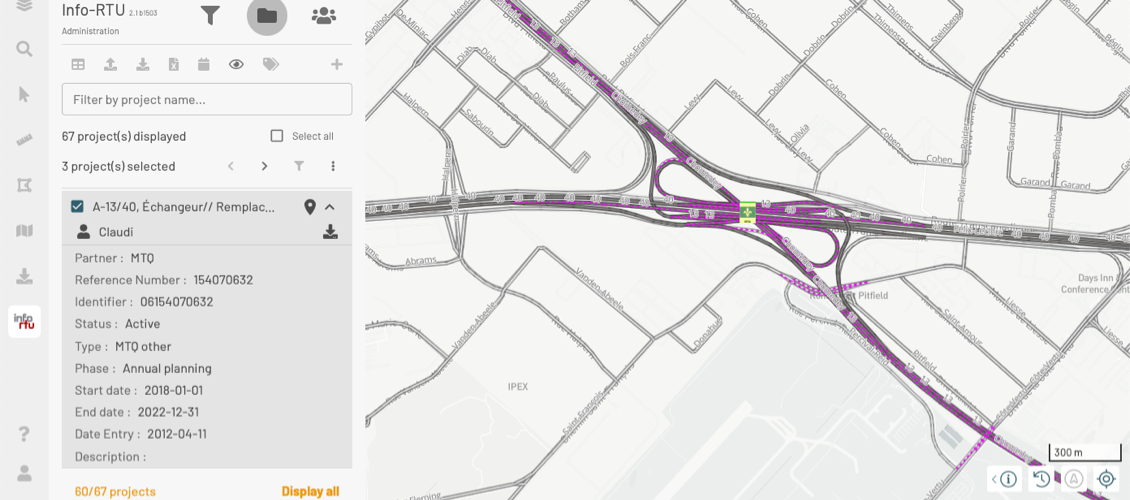
-
Click on
Download project PDF report to download a PDF report containing the project’s details. -
Click on
to hide the project contact person’s information. -
Click on
to close the project’s information card. -
Click on the arrow
. The information card of the next selected project opens. The location of that project is centered in the map.Using these features, you can browse through the selected projects. When you reach the last of the selected projects, the right arrow becomes inactive, and then you can navigate to the previous projects.
Selecting projects from the map
You can also select a project directly on the map. To do so:
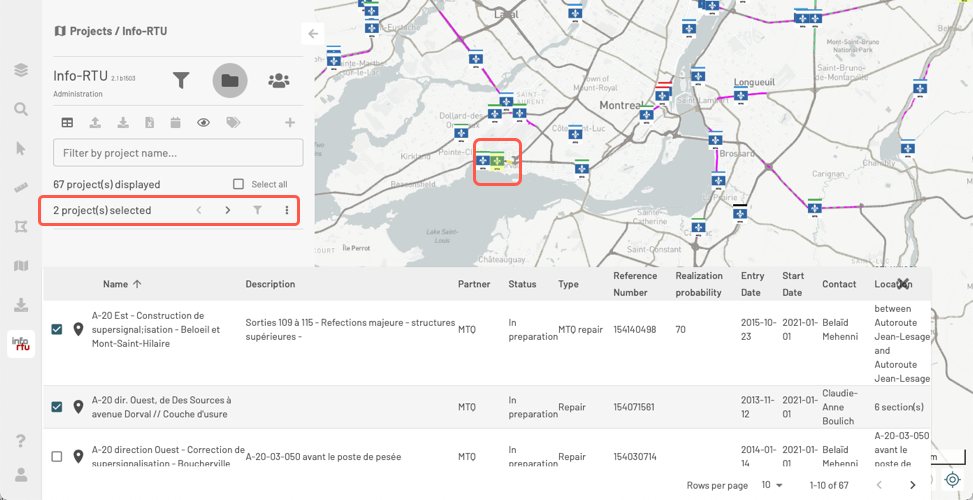
-
Click on the project’s icon to select it. In the map, the icon and location of the project will turn yellow. In the Projects section, the number of selected projects will be displayed.
-
Click on
to display the selected projects. For details on the tools that are available in the card of each project, see Displaying project information.
Selecting projects from the Selection panel in JMap NG
You can select projects outside of the Info-RTU panel by using the interactive selection tools that are available in the Selection panel.
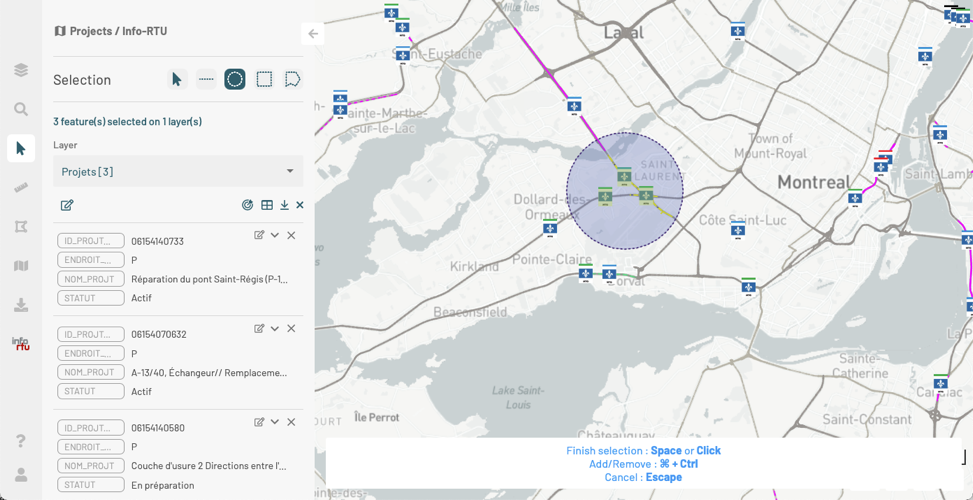
For details on this procedure, see Selecting Elements in the Map in the JMap NG User Manual.
Obtaining a tabular list of projects
You can display the projects in a table. To do so:
-
Click on
Display project data table. The table is displayed in the bottom part of the application.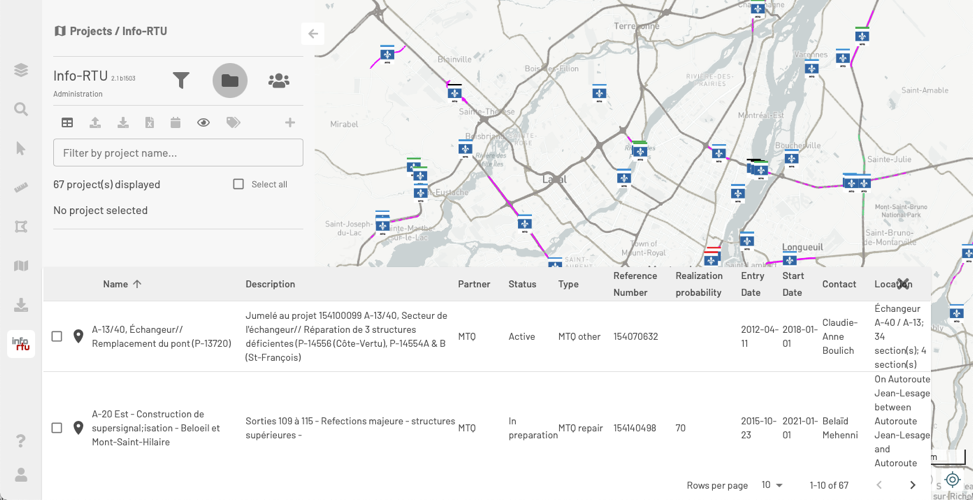
Each project occupies a row in the table. The project attributes occupy the columns in the table.
The table’s data is synchronized with the map data and is automatically updated when the active filter changes or when an action is taken on the map, such as inserting, editing or deleting projects.
You can change the number of projects displayed in the table and browse through the different tables using the
and arrows.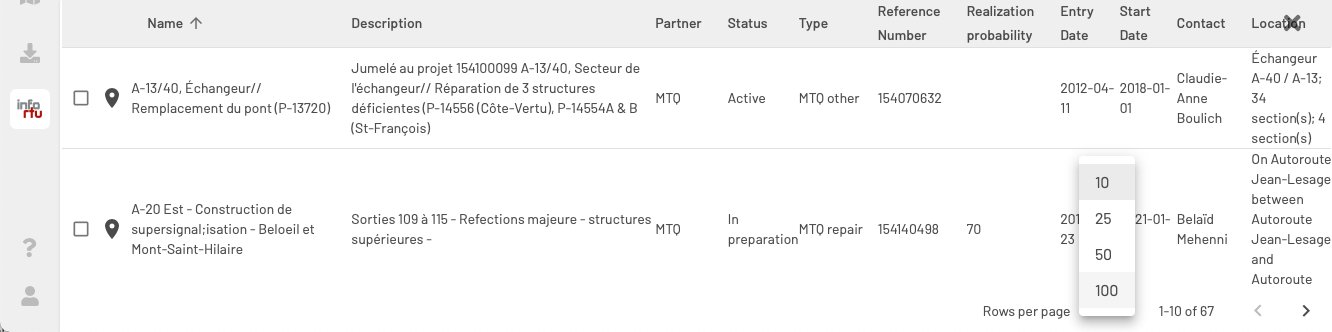
-
Click again on
to close the table.
Sorting the projects in the table
You can sort the projects in the table based on the attribute values. This can be done one attribute at a time by following these steps:
-
Click on the arrow that appears next to the name of the chosen attribute. This allows you to sort the projects in ascending or descending order.
-
Click on other attributes to sort the projects in the table.
Selecting projects in the table
You can select one or more projects directly in the table. You have access to the same tools as when you select projects in the Projects panel.
To select projects in the table:
-
Check the projects of your choice to select them. As described in the Selecting projects section, a legend indicates the number of selected projects, and certain features will become available.
When you select a project’s check box, that project’s icon will flash on the map.
-
Click on
to display only the selected projects in the table. -
Click on
to open the menu offering other features. The available features depend on your permissions.If you do not have permission to edit one of the selected projects, the only available feature will be
Download PDF, which allows you to download a report in PDF format containing information on the selected projects.If you have permission to edit all of the selected projects, the menu will offer other options. For details on these features, see Editing Projects and Deleting a Project.
-
Use the
and arrows to browse through the selected projects. Each time a project is selected, it will be centered in the map, and its icon and extent (emprise) will be colored in yellow and will flash for a few moments. The row of the project is colored for ease of identification.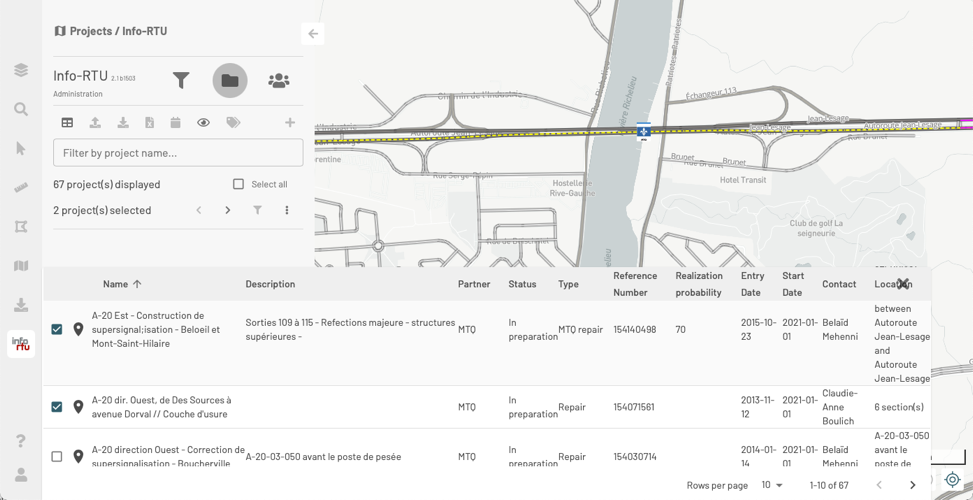
-
Click on
to close the table. The information card of the last project viewed is displayed, and that project remains centered in the map. The other projects also remain selected.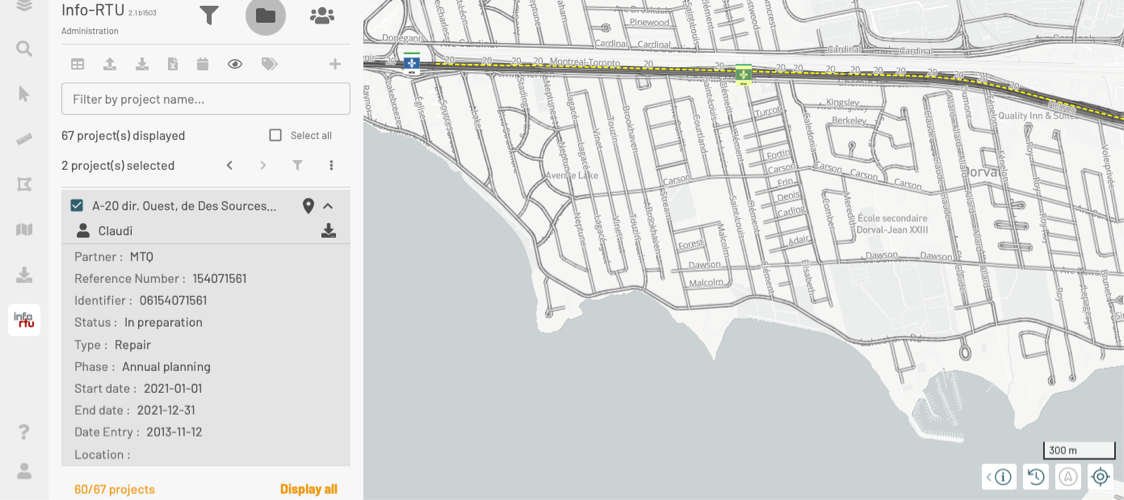
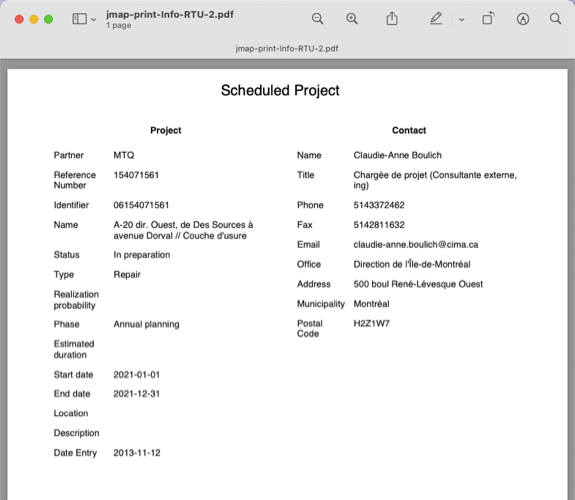
Downloading a PDF report
You can download a PDF report of the projects you are interested in by clicking on the Download project PDF report icon.
When you target a set of projects that were selected from the Projects panel or from the table, the option is available in the menu of the Projects panel.
When you target a specific project, the option is available in the project’s information card.
In any case, the reports are always similar. Each page of the report displays the details of a project.
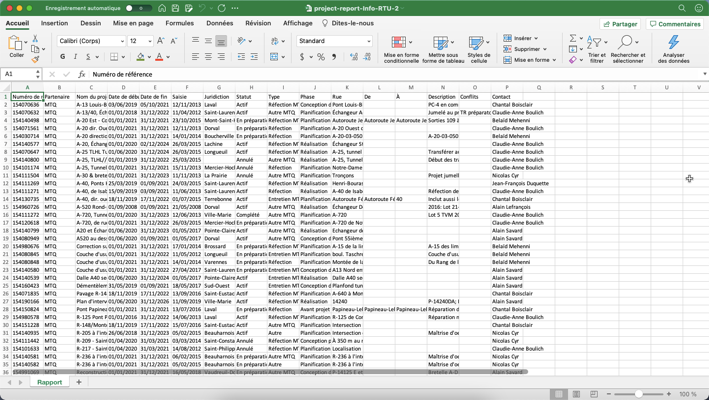
Downloading a report in Excel format
You can download an Excel report containing the details of all the projects displayed in the Projects panel. To do so, click on Download Excel report.
Tracking project changes
You can track the changes that were made to projects over a specific period of time.
-
Click on
to enable this function. The Projects modified since field is displayed.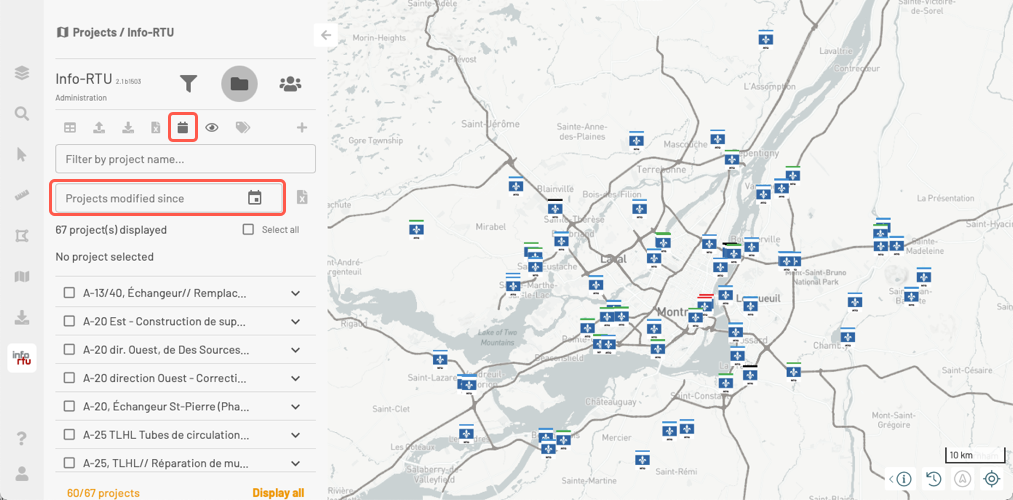
-
Select a date by clicking on
 . Click on the year to change it, and browse through the months to select the day and the month.
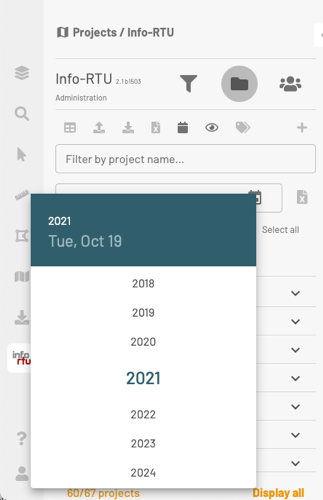
The selected date appears in the field. The projects that were modified since the selected date are displayed in color in the list, and their project symbol is highlighted in the map.
-
Click on
to display the projects in a data table. The modified projects are displayed in color in the table.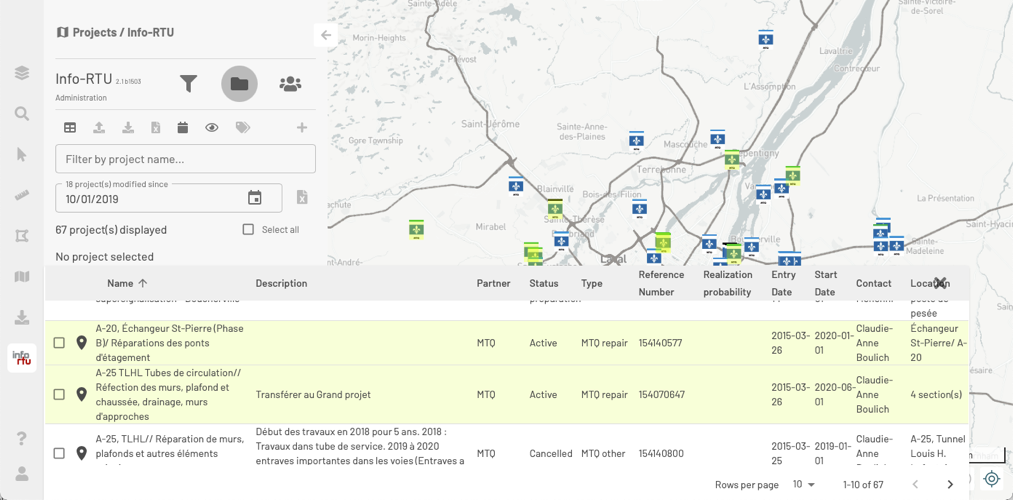
-
Click on
to export a report of the modified projects towards an Excel file.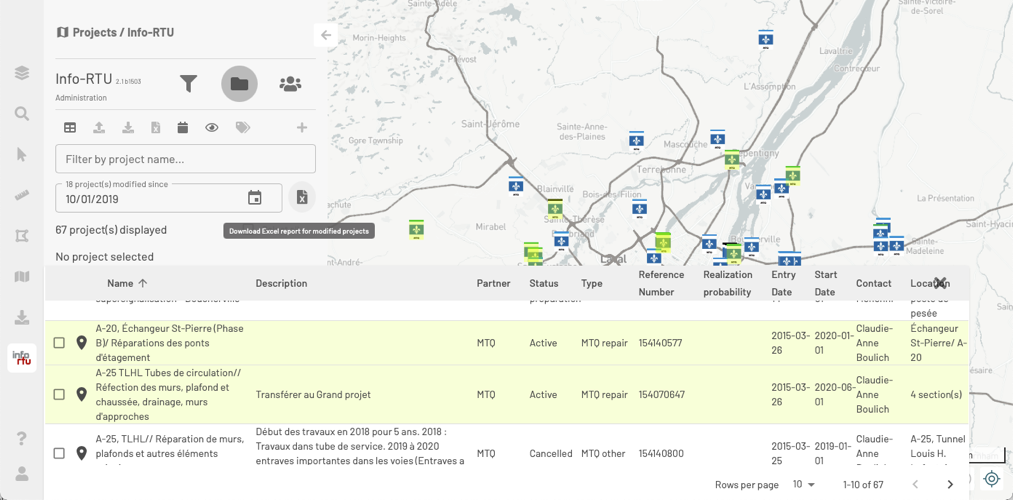
-
Delete the date in the field to close the function.